

Why the US Economy is Soaring While Jobs Vanish
February 6, 2026 Topic: US Economic Data Review #1

If you were looking for clarity from the US economy this week, you didn’t get it. Instead, you got a classic “good news, bad news” sandwich that is likely giving Federal Reserve officials a migraine.
The first week of February 2026 delivered a data dump that paints a picture of an economy in conflict: American factories are suddenly roaring back to life, but employers are pulling the plug on hiring plans at an alarming rate.
Here is the breakdown of the numbers that moved markets this week.
1. Manufacturing is Back from the Dead
Manufacturing PMI: 52.6% (Expansion)
Previous: 47.9% (Contraction)
Trend: First expansion in 12 months
Diagram 1: 3 year ISM Manufacturing PMI Data
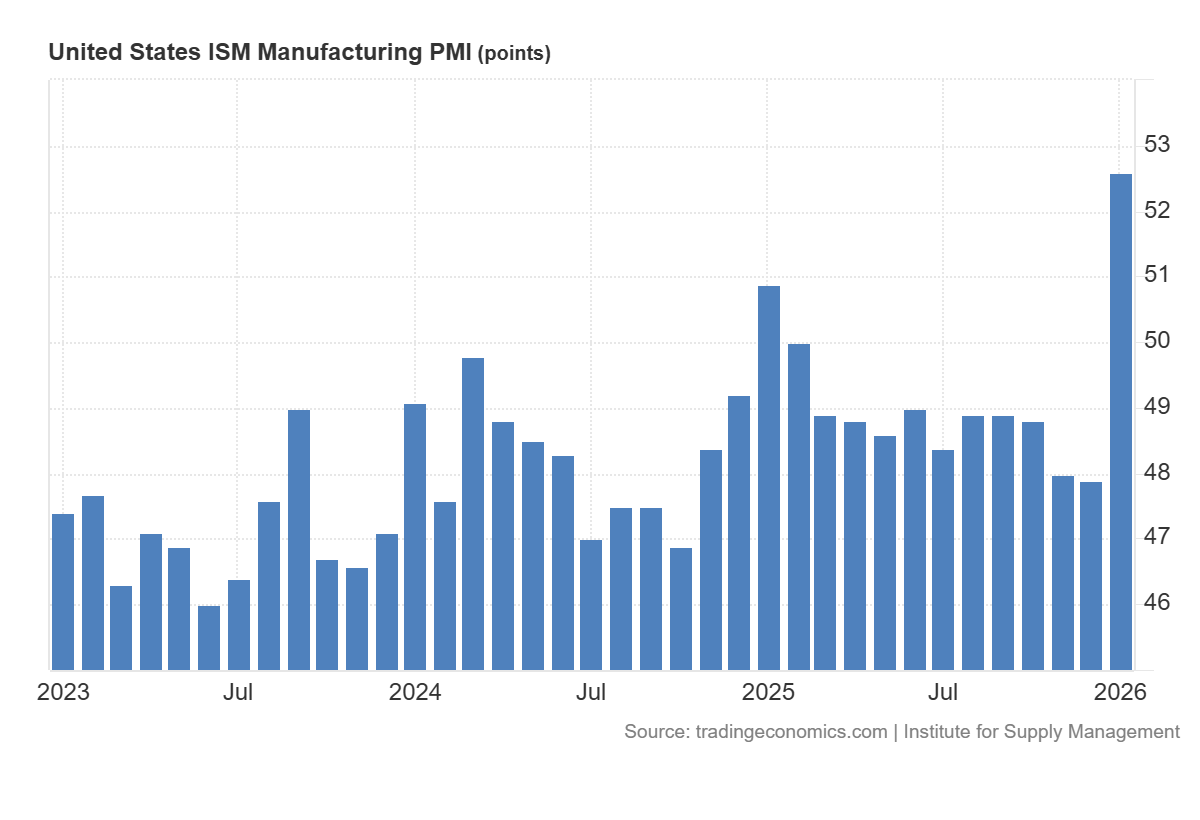
The most significant takeaway is the magnitude of the reversal. A jump of 4.7 percentage points is statistically significant and indicates a hard pivot in sector momentum. The PMI is now comfortably above the 50.0 threshold, signaling that the goods-producing side of the economy is no longer a drag on growth but a contributor.
The Drivers: Demand and Output synchronize
The recovery is being driven by a classic “demand-pull” dynamic, where rising orders force factories to ramp up production.
New Orders (57.1%): This index skyrocketed by 9.7 percentage points to its highest level since February 2022. The surge suggests that customers who spent 2025 destocking are now aggressively placing orders to replenish shelves and get ahead of price hikes.
Production (55.9%): Mirroring demand, output jumped 5.2 points to hit a nearly four-year high. Factories are running hotter to meet the influx of new business.
Backlog of Orders (51.6%): For the first time since August 2022, backlogs are growing. This is a crucial “green shoot” because it provides factories with a pipeline of work, securing production schedules for Q1 and potentially Q2.
The Supply Chain: Tightening and Inflationary
The rapid shift to growth is immediately stressing the supply chain, reviving concerns about inflation that had largely dormant in the goods sector.
Supplier Deliveries (54.4%): Deliveries slowed faster in January. In the ISM methodology, a number above 50 indicates slower deliveries, which typically happens when demand outstrips supplier capacity.
Prices (59.0%): The “transitory” disinflation narrative is facing a challenge. The Prices Index rose to 59%, marking the 16th consecutive month of increases. Manufacturers are paying more for aluminum, copper, steel, and freight.
Inventories: There is a stark divergence here. Manufacturer inventories are contracting (47.6%), while Customers’ Inventories (38.7%) are at “too low” levels not seen since mid-2022. This imbalance low stock vs. high demand is a recipe for continued aggressive ordering and pricing power for producers.
The Employment Paradox
Despite the boom in orders and output, the Employment Index (48.1%) remains in contraction, though it did improve by 3.3 points.
This divergence suggests a focus on productivity over headcount. Panelists noted that “managing head counts is the norm,” implying that companies are hesitant to hire full-time staff until they are certain this demand spike is sustainable. Alternatively, the shortage of labor (cited as a commodity in short supply) may be physically preventing hiring rather than a lack of intent.
The “Tariff” Factor Is A Double-Edged Sword
Qualitative responses from executives highlight a specific anxiety: Trade Policy. The word “tariff” appears frequently in industry comments, acting as both a stimulant (buy now before taxes go up) and a depressant (uncertainty kills long-term planning).

Machinery: Executives warn that new EU tariff threats could wipe out profits on current orders.
Chemicals: Firms are shifting supply chains from China to Mexico to avoid duties, only to face new potential tariffs on Mexican imports.
Fabricated Metals: “Confused and uninformed tariff policies” are making capital commitments beyond 30 days impossible.
This suggests that some of the January order surge may be “pre-buying” to front-run expected cost increases, rather than organic end-user demand. So overall this data reading is more likely to be a short-term tailwind, but not a structural on-shoring of manufacturing change.
Sector Winners and Losers
The recovery is broad but not universal. Of the six largest industries, five expanded:
Transportation Equipment
Machinery
Chemical Products
Food, Beverage & Tobacco Products
Computer & Electronic Products
However, industries like Petroleum & Coal Products and Nonmetallic Mineral Products remain in contraction, highlighting pockets of weakness.
2. Services Hold the Line
Data: ISM Services PMI (Jan)
Actual: 53.8 | Previous: 53.8 | Consensus: 53.5
If the Manufacturing report earlier this week was a “shock to the upside,” the ISM Services report is the steady hand keeping the ship afloat.
Diagram 2: 3 year Services PMI Data
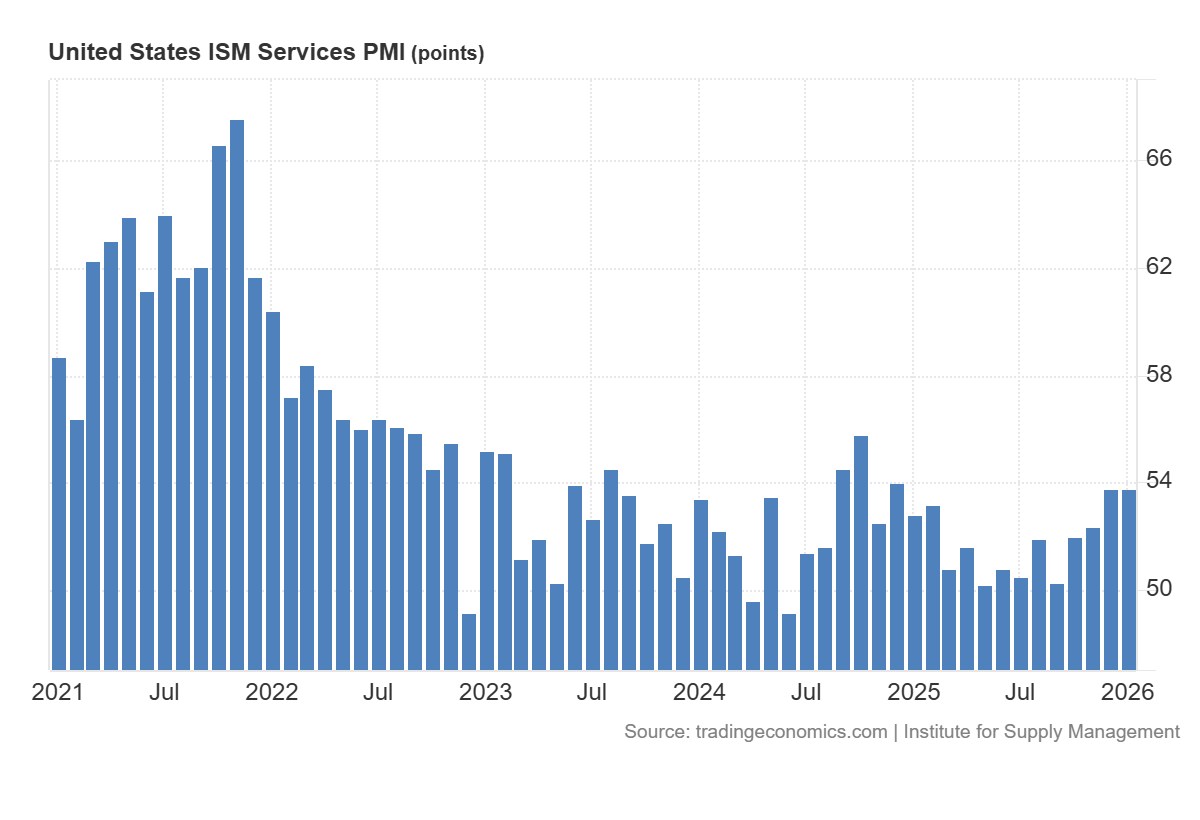
Coming in at 53.8% unchanged from December and the services sector (which makes up >70% of the US economy) is showing remarkable resilience. But beneath the flat headline number lies a chaotic mix of booming tech demand, crashing export orders, and a reignited inflation fight.
Here is what you need to know about the engine room of the American economy.
Activity is Accelerating
While the headline PMI was flat, the most important sub-index actually surged.
Business Activity (57.4%): This measures what companies are actually doing right now. It jumped 2.2 points to hit its highest level since October 2024.
The Driver: Data Centers. The commentary from the Construction and Utilities sectors was explicit. One utility respondent noted that “Data centers are causing large spikes in requirements,” while another flagged a shortage of chips due to “data center buildouts taking all available OEM inventory”. The AI infrastructure boom is real, and it is moving the needle on national economic data.
Exports Collapse
The most alarming data point in the entire report was New Export Orders.
The Drop: It cratered 9.2 points to 45.0%, falling deep into contraction.
The Reason: Trade War Anxiety. This is likely the first tangible economic scar from the recent tariff escalation. Foreign buyers are pulling back, either due to retaliatory measures or pure uncertainty. If the US consumer wavers, we can no longer count on global demand to fill the gap.
The Inflation Problem Is Not Going Away
For the Federal Reserve, this report is a “good news, bad news” situation. The good news is the economy is growing. The bad news? Prices are sticky.
Prices Index (66.6%): This metric rose 1.5 points and has now been above the critical 60% level for 14 consecutive months.
Why? It’s not just commodities anymore. It’s labor and “tariff premiums.” Respondents across multiple sectors (Real Estate, Professional Services) cited the threat of tariffs as a reason to hike prices now. This is psychological inflation, and it is much harder for the Fed to kill with interest rates (their policies aren’t even optimal to combat this)
While factories surged, the much larger services sector simply held its ground. The print of 53.8 matched the previous month exactly. This is “Goldilocks” data not hot enough to reignite inflation fears, but not cold enough to signal a recession. It suggests the core engine of the US economy is stable, providing a floor even as other indicators wobble.
3. The Labor Market Cracks
Data: JOLTs Job Openings (Dec)
Actual: 6.542M | Previous: 6.928M | Consensus: 7.2M
If the ISM Manufacturing report was the “bull case” for the economy, the labor data released this week is the undeniable “bear case.”
For two years, the US labor market has been the unshakeable pillar of the post-COVID economy. “Help Wanted” signs were everywhere, and workers held all the leverage. Based on the charts crossing the terminal today, that era is officially dead.
We are witnessing a sudden and synchronized deterioration in labor demand. The “Great Resignation” has been replaced by the “Great Rationalization.”
Diagram 3: 3 year Jolts Data
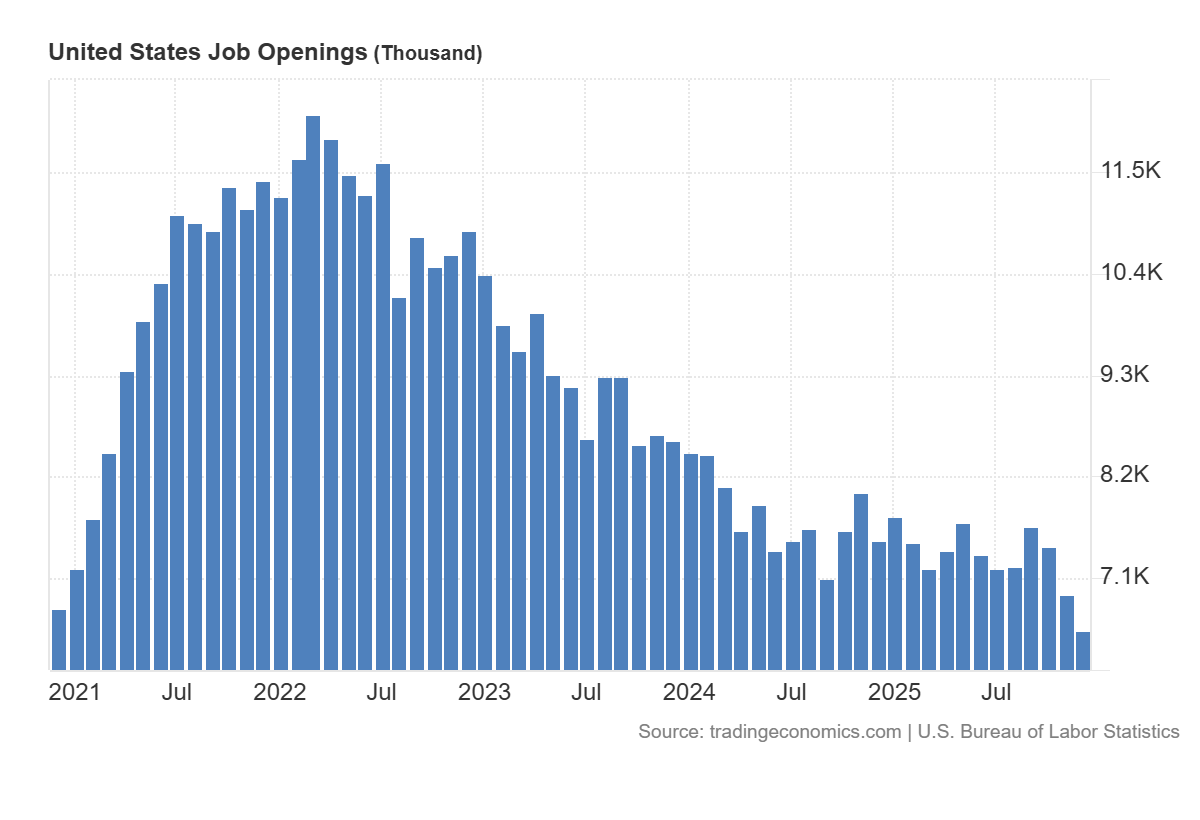
The top chart tells the story of vanishing opportunity.
The Data: US Job Openings have plummeted to 6.54 million.
The Trend: We are now effectively back to pre-pandemic levels, having erased the entire “excess demand” bubble of 2021–2022. At its peak, there were nearly 12 million open roles. That number has been cut almost in half.
The Implication: The “labor hoarding” behavior we saw last year is over. Companies are no longer terrified of being understaffed; they are terrified of being bloated. The ratio of job openings to unemployed workers is compressing rapidly, removing the primary driver of wage inflation.
While openings are vanishing, pink slips are flying. The bottom chart from Challenger, Gray & Christmas is perhaps the most alarming data point of the week.
Diagram 4: Job-cut Announcements
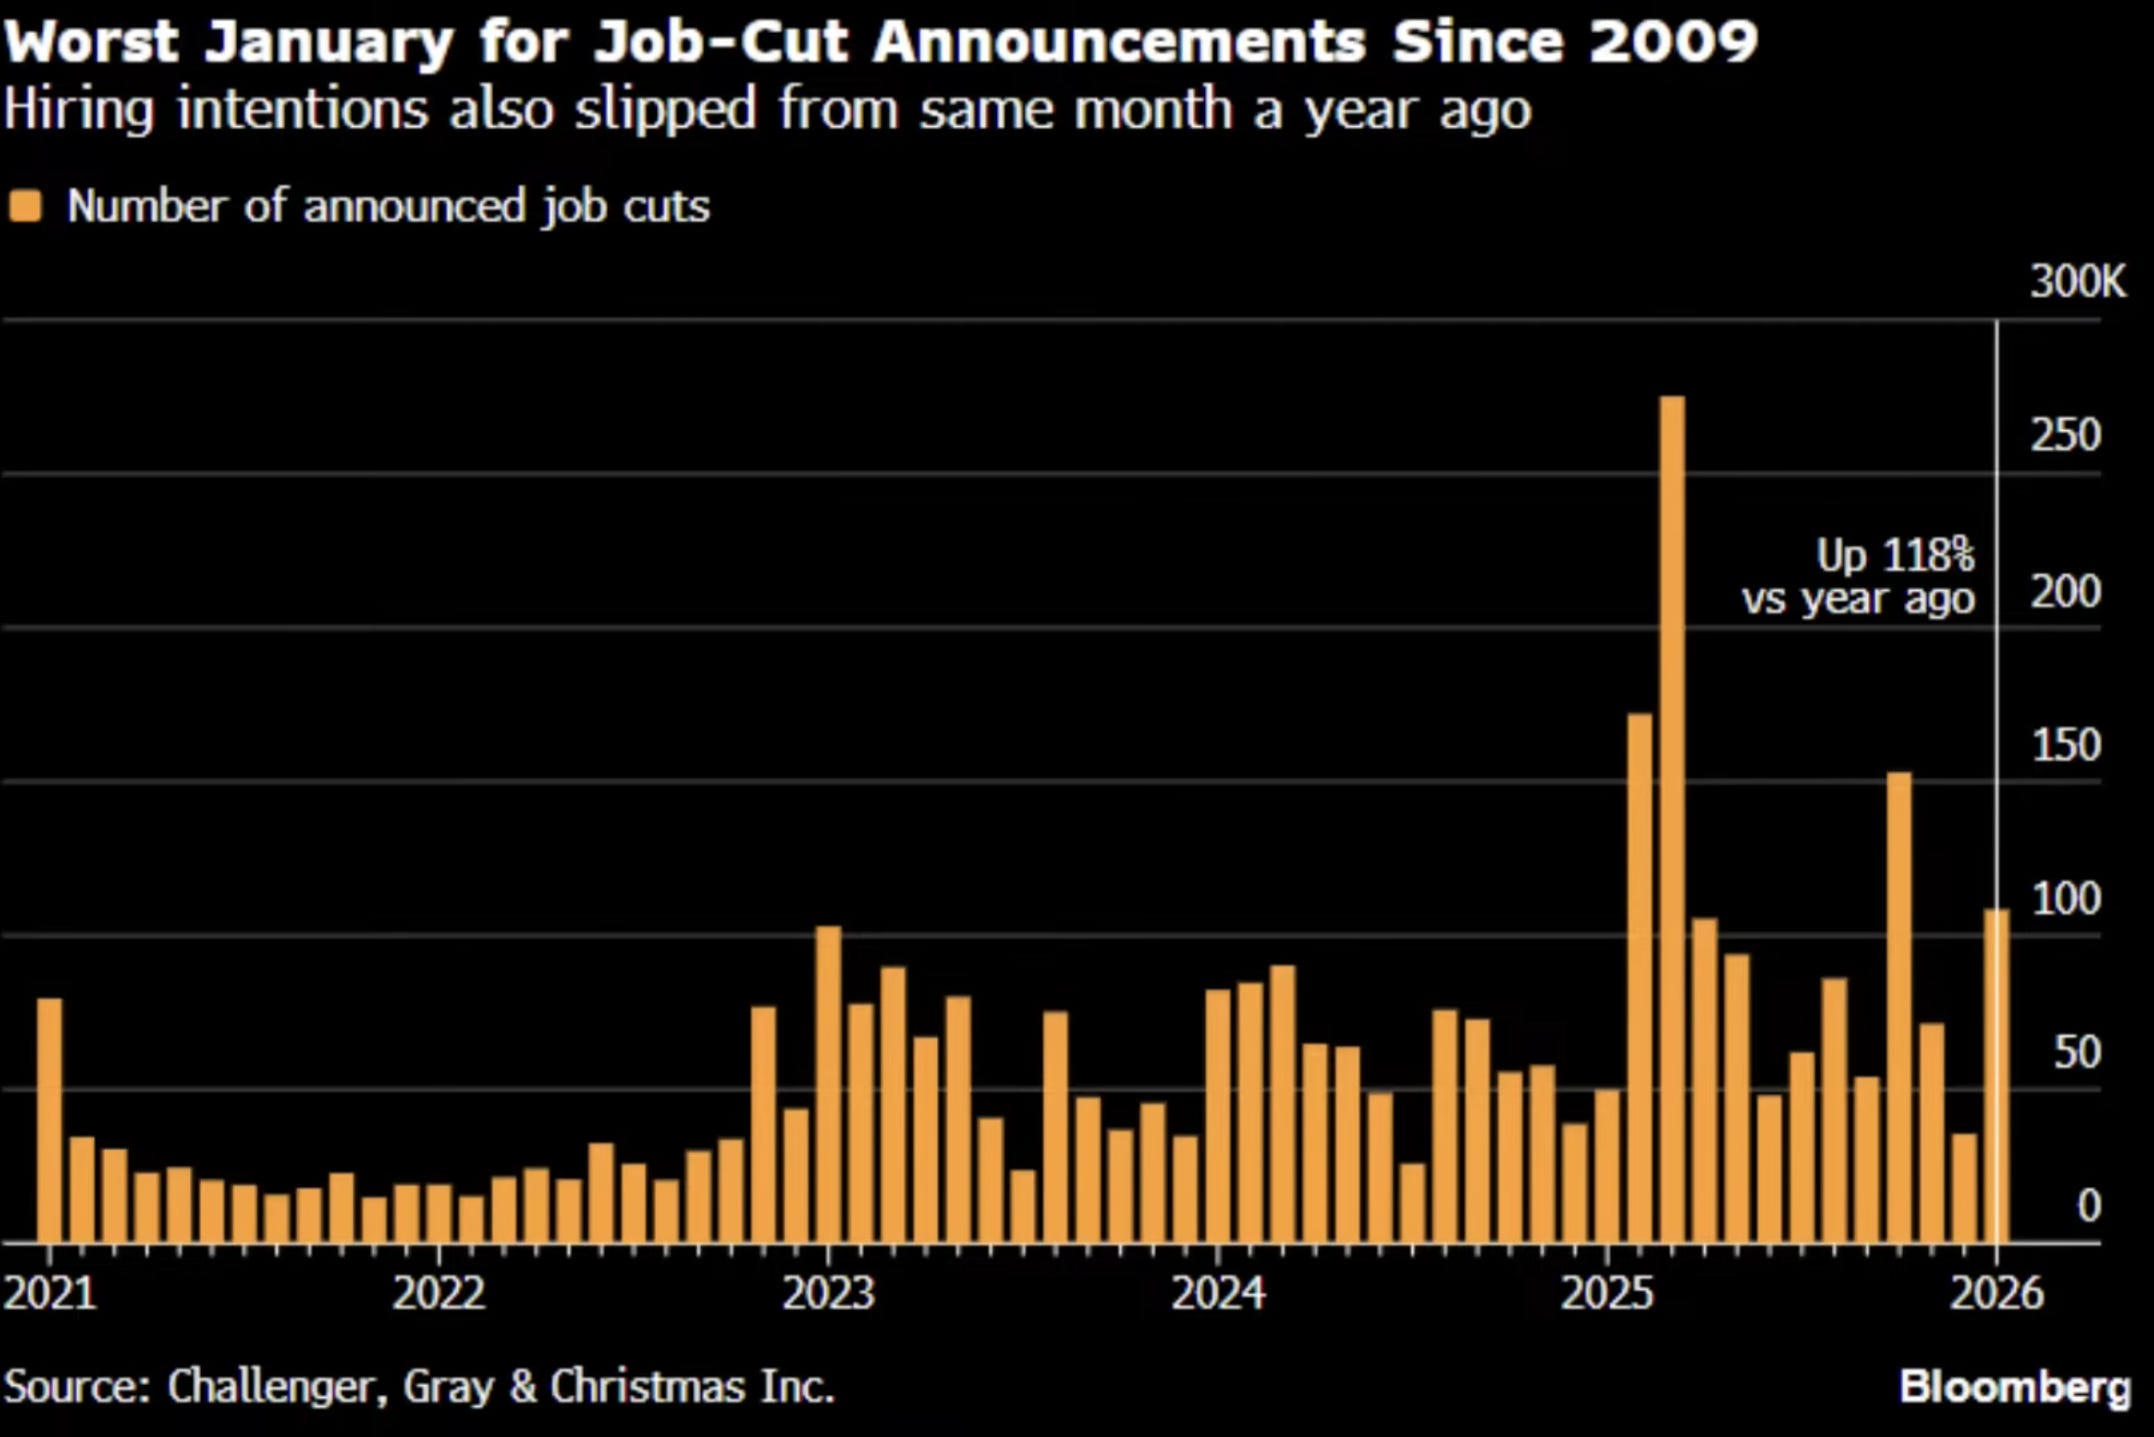
The Data: Job cut announcements in January skyrocketed, marking the worst January for layoffs since 2009 the height of the Great Financial Crisis.
The Spike: Layoffs are up 118% year-over-year. This isn’t a gradual cooling; it is a sudden freeze.
The Drivers: This aligns perfectly with the corporate commentary we heard in earnings calls. “Restructuring” and “Efficiency” are the keywords. Companies are protecting margins by cutting headcount, specifically in white-collar sectors (Tech, Finance, Media).
4. Consumers Are (Slightly) Less Miserable
Data: Michigan Consumer Sentiment (Prelim Feb)
Actual: 57.3 | Previous: 56.4 | Consensus: 55.0
We ended the week with a modest sentiment beat. A reading of 57.3 is better than the expected 55, but let’s be realistic: historically, these are still recessionary levels. Consumers are slightly less pessimistic than last month, likely buoyed by stabilizing inflation, but they certainly aren’t euphoric. The “vibecession” lingers, even if it’s thawing.
Diagram 5: Mihigan Conumer Index The Last 10 years
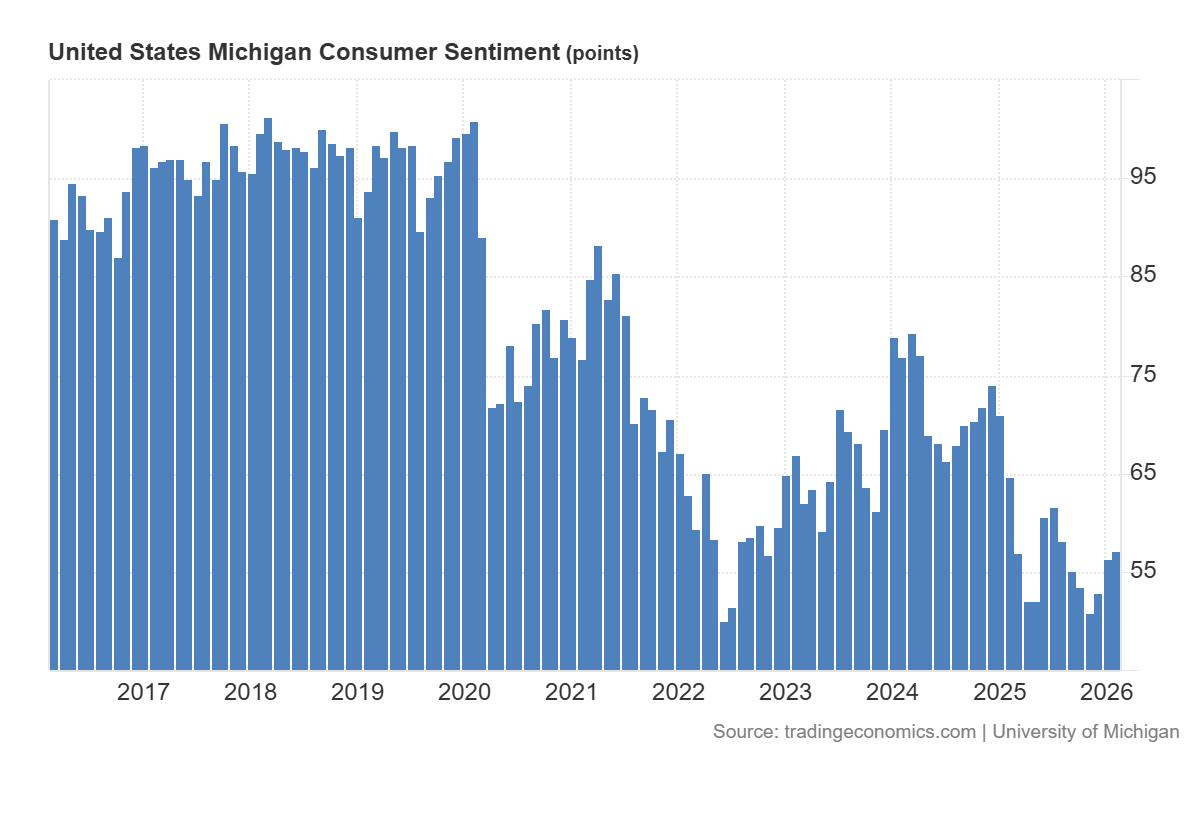
We aren’t back to the euphoria of 2019 (90+), but we have firmly established a floor above 55. This suggests that the “shock” of higher prices has worn off. Consumers have adjusted to the new normals. They aren’t happy about it, but they are no longer panicked by it.
What’s fascinating is the disconnect between this chart and the Labor chart we just analyzed. Usually, layoffs kill sentiment. But here, sentiment is rising while job openings fall. This implies that inflation was the primary driver of misery, not the labor market. As inflation cools, mood improves even if the job market gets a little shakier.
Atlanta Fed GDPNow Projection Changed
If you are looking for evidence that the US economy is ignoring gravity, look no further than the Atlanta Fed’s GDPNow model.
Diagram 5: Atlanta Fed GDPNow
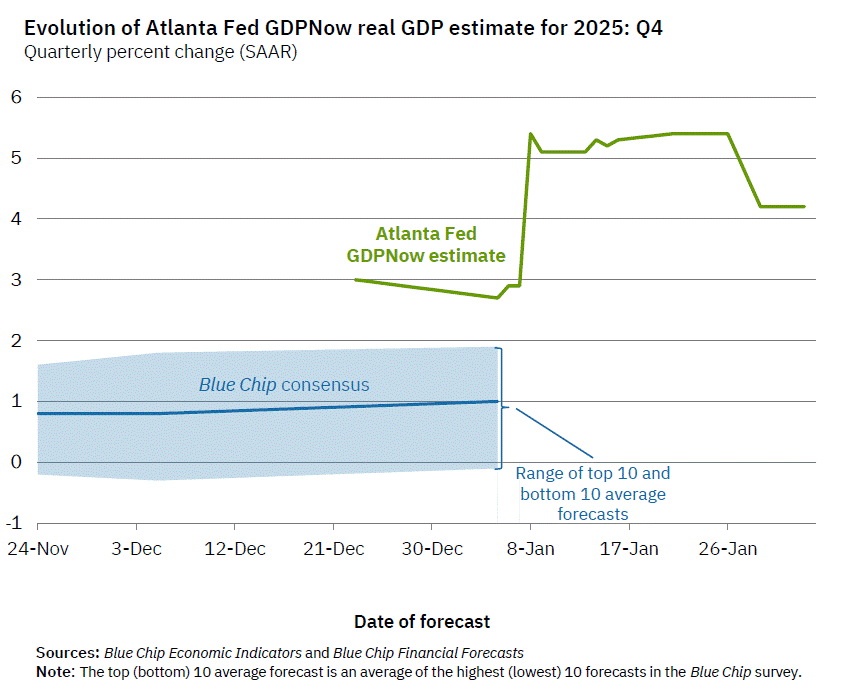
While Wall Street economists (the “Blue Chip Consensus”) spent the last quarter predicting a slow drift toward 1% growth, the real-time data has been screaming something entirely different.
Even after a modest pullback in late January, the model is settling at ~4.2%.
The Takeaway: The US economy is growing at 4x the rate that the average economist predicted. This is strong growth.
The AI Capex Supercycle
How does a mature economy suddenly accelerate to 4%+ growth with interest rates this high? The answer lies in the Capex (Capital Expenditure) figures we are seeing from Big Tech.
Diagram 6: Big Tech Hyperscalers

The ISM Services report gave us a hint (”Data centers are causing large spikes in requirements”), but the earnings calls from Amazon, Google, and Microsoft confirmed it. We are in the middle of an infrastructure arms race that has no price sensitivity.
The “Productivity” Pivot and the Fed’s Dilemma
If you felt whiplash this week, you aren’t alone. The economic data just delivered a masterclass in mixed signals, painting a picture of an economy that is simultaneously accelerating and braking.
On one hand, the industrial engine is roaring. The ISM Manufacturing PMI (52.6%) snapped a 12-month losing streak, exploding back into expansion. Factories are busy, order books are filling up, and the “goods recession” is officially dead. This is being supercharged by a massive AI Capex Supercycle, with Big Tech pouring billions into infrastructure that is driving the Atlanta Fed’s GDPNow model to a staggering 4.2% growth estimate.
On the other hand, the labor market is cracking. Job openings (JOLTS) collapsed to pre-pandemic levels, erasing millions of vacancies. Layoffs in January spiked 118% year-over-year, marking the worst start to a year since the Great Financial Crisis.
So, how do we reconcile a booming economy with a shrinking job market?
The answer is Productivity. Corporate America has shifted gears. In the post-COVID frenzy, growth was achieved by throwing bodies at the problem. In 2026, growth is being driven by efficiency. Companies are using technology, automation, and leaner teams to produce more output with fewer people.
The Fed’s Rate Path: Calm Before the Storm?
Despite this volatility, interest rate probabilities did not meaningfully change this week. The market is still digesting the “Goldilocks” manufacturing data, which suggests the economy is too hot for aggressive immediate cuts. The Fed is currently paralyzed by the conflicting signals: robust GDP growth argues for “higher for longer,” while a deteriorating labor market screams for relief.
Diagram 7: Target Rate Probabilities for March 18th Meeting
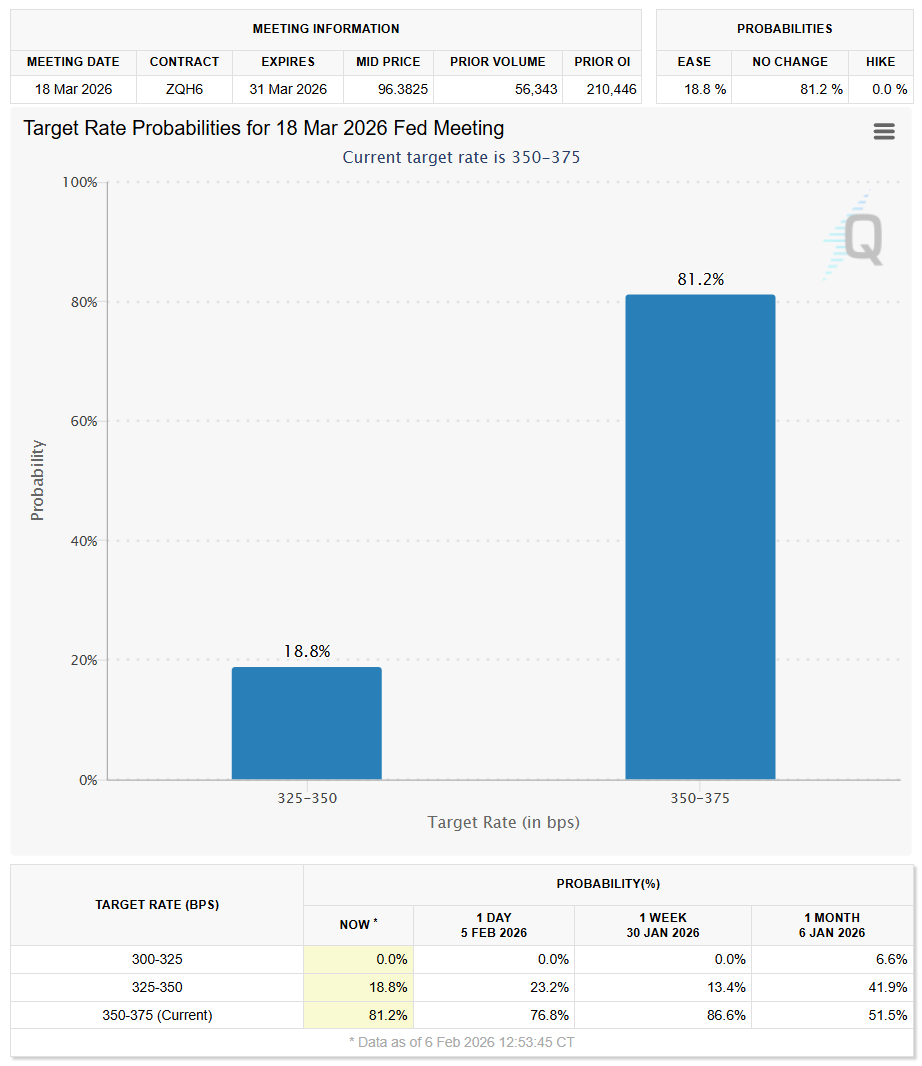
However, the ice is thinning. We are fast approaching a tipping point where the Fed may be forced to cut into weakness.
Historically, the Fed cuts rates for one of two reasons:
To celebrate victory over inflation (a “soft landing” cut).
To stop the bleeding in the labor market (a “hard landing” panic cut).
With job openings vanishing and layoffs surging, the narrative is shifting from the former to the latter. If the labor market continues to deteriorate at this pace, the Fed will no longer be cutting rates because they can (inflation is down), but because they must to prevent a white-collar recession. The “Productivity Boom” is great for margins, but if it comes at the cost of employment, the consumer and eventually the Fed will hit a wall.
Thank you for reading my article!
See you soon,
Lukas, Pixel Research
For more market commentary, stock picks and economics please consider to subscribe for weekly content!
Works Cited
I hope you like this article!
Excellent analysis! The productivity pivot framing is crucial here because it explains why the Fed's tradicional playbook doesn't work. When growth comes from efficiency gains rather than labor expansion, you get this weird decoupling. The most interesting implication is that the Fed might be forced into a "panic cut" scenario not because of weak GDP but becuase employment craters while output stays strong.