

Unknown Cash-Pay Pharmacy Growing At Triple Digit Rates
TelyRx Holdings Inc. (TSX: TELY | OTCQX: TELYF) is avertically integrated digital pharmacy at ~0.6x EV/Sales on its own 2026 outlook, fresh off an RTO, with escrow and private placement unlocks still
In a market that pays double-digit sales multiples for telehealth growth stories, the most interesting setups are sometimes the ones that just listed quietly through the back door, and immediately fell 45% from their highs.
Enter TelyRx Holdings Inc. (TSX: TELY) at roughly C$2.45 per share(used for the full analysis), an implied market capitalization of ~US$86 million and an enterprise value of roughly US$70 million against a management outlook of US$113 million in 2026 revenue and US$4 million in adjusted EBITDA. That is around 0.6x EV/forward sales for a business that grew revenue 180% year-over-year last quarter at a 55% gross margin.
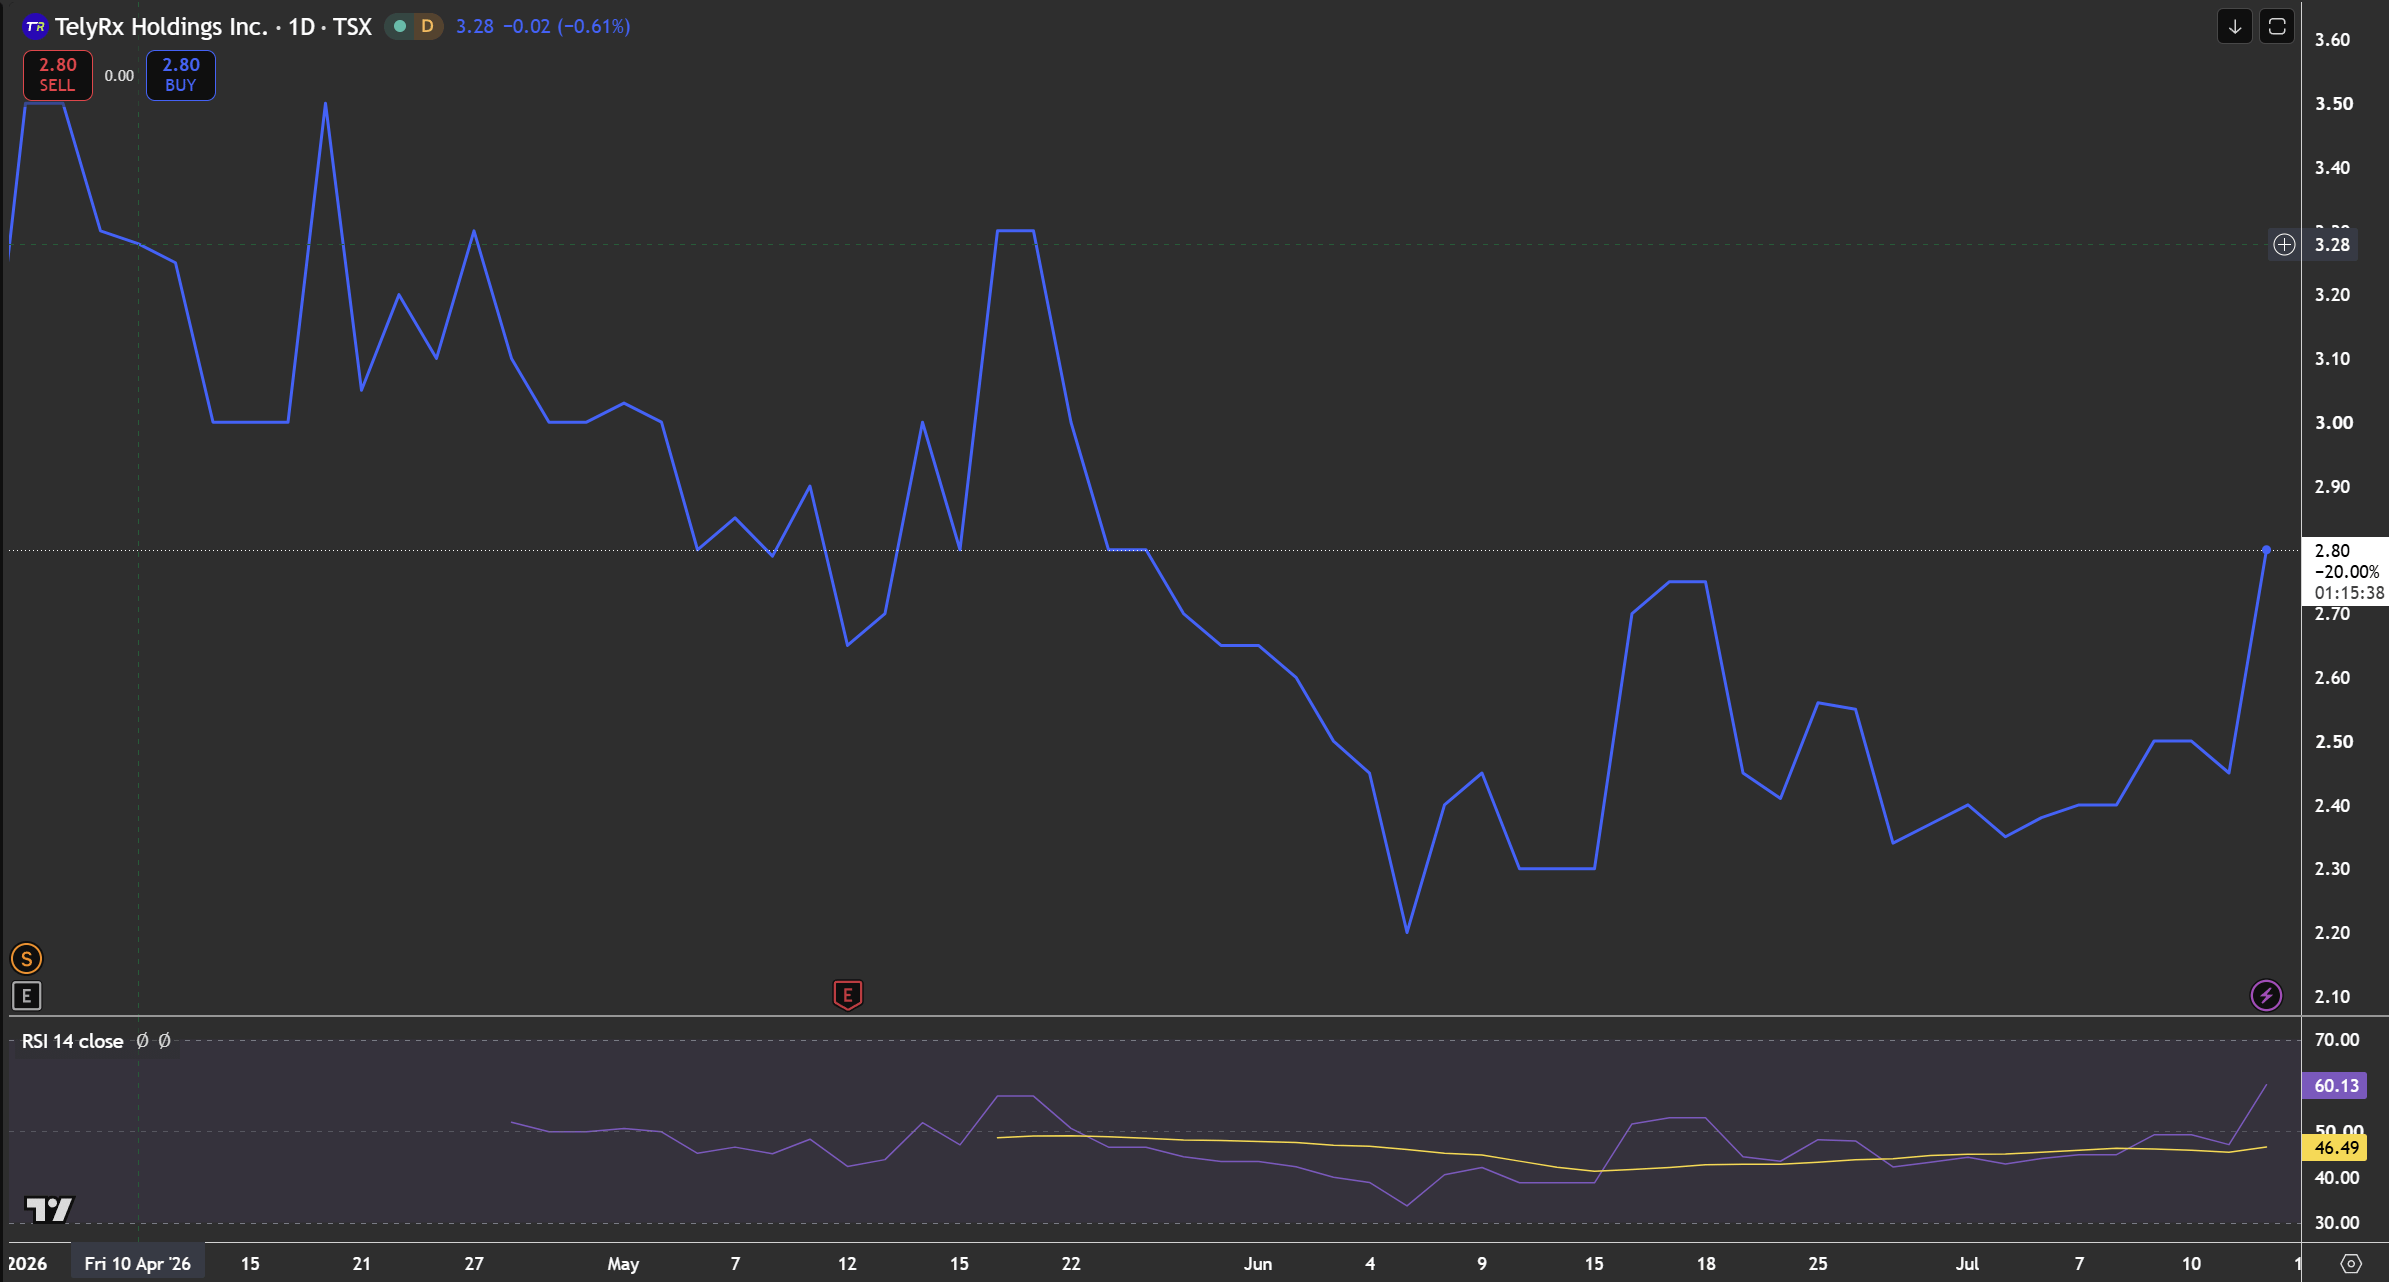
TelyRx listed on the TSX on March 31, 2026 via a reverse takeover of Apolo V Acquisition Corp., a capital pool company. The stock printed an all-time high of C$4.25 on April 7, the same price as the concurrent financing and an all-time(intra-day) low of C$2.00 on May 8. All numbers below are in USD unless stated otherwise.
Diagram 1: TELY Share Price (C$4.25 ATH April 7, C$2.00 low June 5th ~C$2.2, Currently ~C$2.8)
Why it is interesting now:
Growth at a non-growth multiple
2024 revenue of $9.5M became $42.9M in 2025 and $19.4M in Q1 2026 alone (180% y/y, ~8.9% compounded monthly growth in the quarter). The 2026 outlook of $113M implies which is over 160% top-line growth, and the company reiterated it on the Q1 call.
Clean, simple balance sheet
$27M cash, $10.2M of long-term bank debt, $0.7M of accounts receivable. This is a cash-pay business, there is no insurance receivable risk, no PBM(Pharmacy Benefit Manager,the middleman that runs prescription drug coverage for insurers and employers) clawbacks, no working capital sinkhole.
Variable-cost machine
the largest expense line is discretionary digital marketing ($8.1M of $13.6M total opex in Q1). Management can throttle spend in real time, which is why operating FCF was only -$0.7M despite the reported loss.
A genuine overhang
~8 million private placement shares come free trading around the start of August 2026, and escrowed founder shares release in tranches every six months. This is likely why the stock is cheap and the next few months may offer even better prices.
The Business
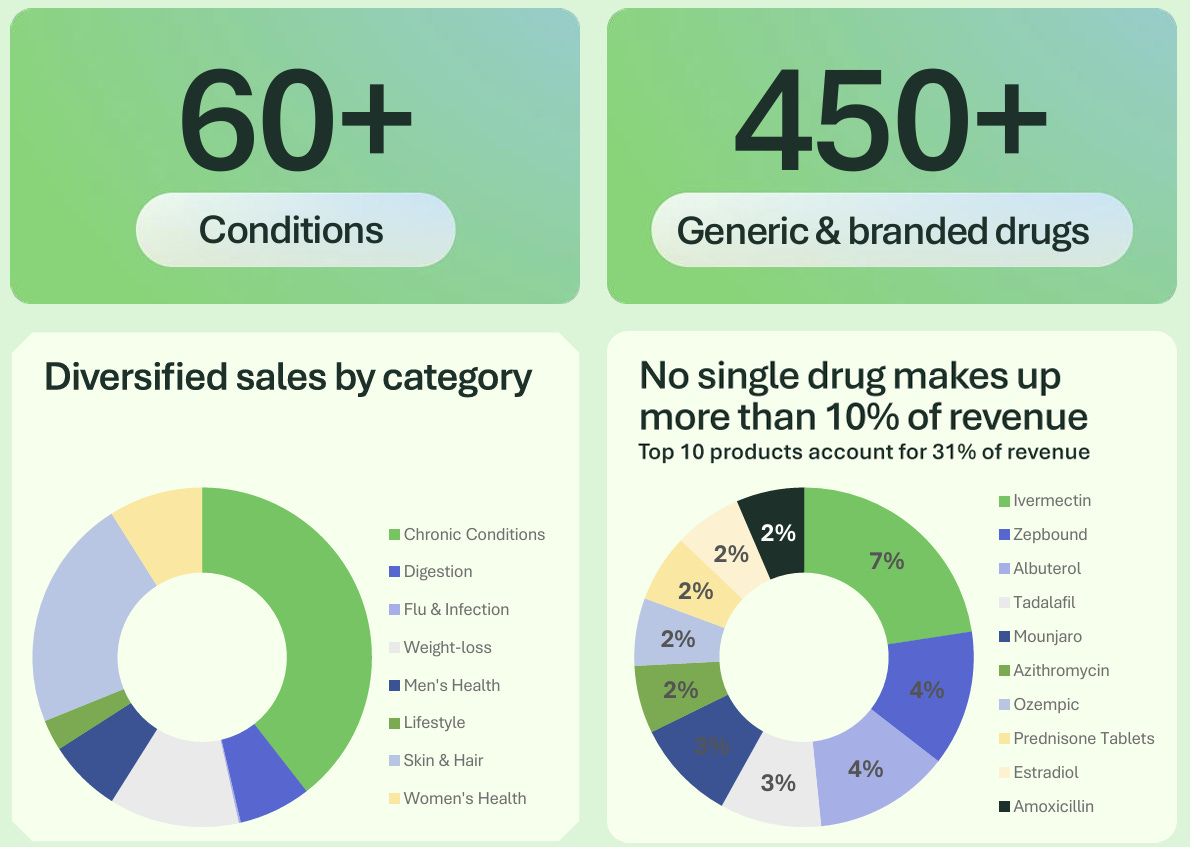
TelyRx is a vertically integrated, technology-enabled digital pharmacy. A patient browses a formulary of 450+ FDA-approved generic and branded medications covering 60+ everyday conditions, completes a history & physical questionnaire, and pays the cost of the medication plus a flat $22 physician review fee.
Diagram 2: Customer Experience
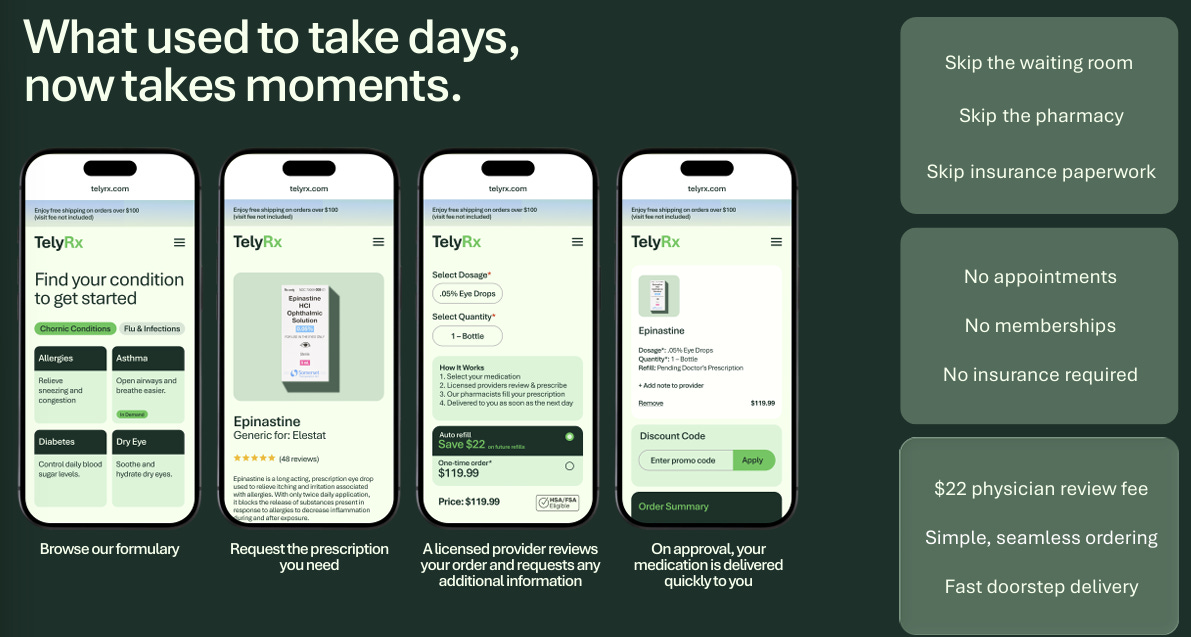
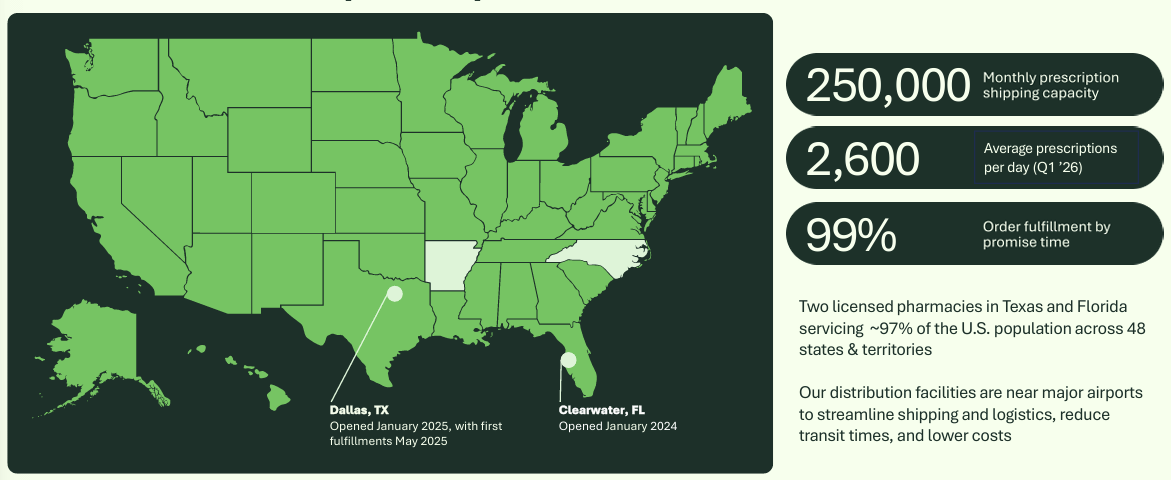
An independent, state-licensed provider (contracted through 14 third-party practice groups, TelyRx does not employ them) reviews and prescribes. TelyRx’s own two licensed pharmacies in Clearwater, Florida and Dallas, Texas dispense and ship, usually within 24 hours, reaching ~97% of the U.S. population across 48 states with a capacity of 250,000 prespections on a monthly basis. One of the two TelyRx pharmacy locations is leased from a related party entity that is partially owned by a shareholder of the Company.
Diagram 3: Distribution Network, and Order Capacity
No appointments, no waiting rooms, no insurance and 100% cash pay. The formulary deliberately excludes all controlled and compounded substances (no DEA registration needed), and no single medication exceeds 10% of revenue. This is not a one-drug GLP-1 story; it is closer to a diversified e-commerce store for everyday medicine think of it as Hims & Hers’ model applied to amoxicillin, albuterol and estradiol rather than four or five lifestyle conditions.
Diagram 4: Overall Offerings
Founded in 2022, first revenue in late 2023/January 2024. Two years later it is running at a ~$80M annualized revenue pace with a higher revenue forecast than that where most of it is from recurring customers, with a small percentage of newly acquired customers. For a business increasingly reliant on recurring prescriptions and repeat customers, customer satisfaction is particularly important.
Diagram 5: TelyRx Trustpilot Reviews

A growing recurring revenue base reduces dependence on incremental customer acquisition spending, allowing a larger share of revenue to convert into earnings over time. In this context, strong customer reviews may represent more than just a marketing asset as they could be an indicator of future retention rates and operating leverage, above we can see amazing reviews for TelyRx.
The Market
Everyone in U.S. pharmacy is fighting over the $585 billion insured prescription market. TelyRx is instead targeting the $98 billion out-of-pocket cash-pay segment, which the company says has compounded at ~40% since 2019. The tailwinds are real as ~2,300–2,500 brick-and-mortar pharmacies closed in 2024 alone, 15.8 million Americans now live in “pharmacy deserts”, and average physician appointment waits stretch to weeks in major cities.
Diagram 6: Makret Opportunty for Cash-payments
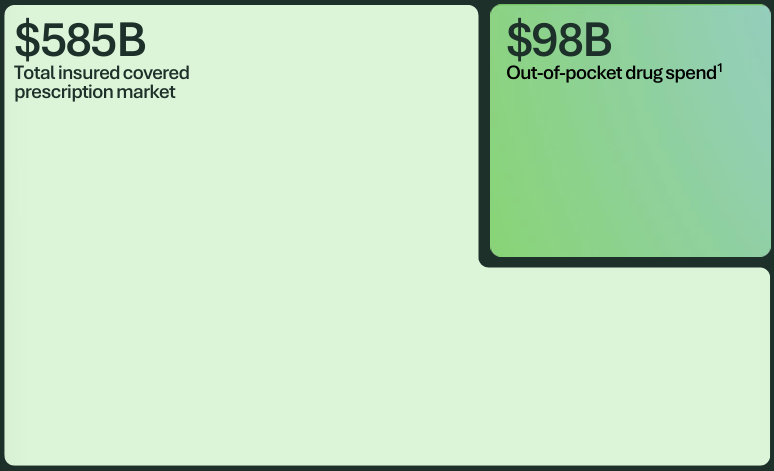
The pitch is that for everyday medication, convenience beats coverage and notably, patients are paying TelyRx cash even when they have insurance. The counterpoint, which I’ll return to in the risk section is that for insured patients the insured route is often cheaper, and $98 billion is still six times smaller than the market TelyRx is structurally locked out of.
In addition, the cash-pay segment got some governmental assistance in a way as TrumpRx.gov, the federal portal launched February 5, 2026 that points cash-paying patients to manufacturer discounts at “most-favored-nation” prices expanded in May to 600+ generics, with 17 manufacturer deals covering ~86% of the branded market, and explicitly cash-pay only. The biggest friction in TelyRx’s growth plan was that most of the $98B market didn’t know paying cash for medicine was even an option, and teaching them was what the marketing budget bought. The federal government is now running that education campaign for free, at zero CAC to TelyRx. (The bill for this gift arrives in the competition section.)
Management
The investor deck leads with “Deeply Experienced & Dynamic Team, $3.3B+ in exits.” Since the presentation is, frankly, buzzword-heavy, I went and verified the claims person by person. The short version is that the headline exits and are real transactions, but the framing matters.
Diagram 7: Management overview
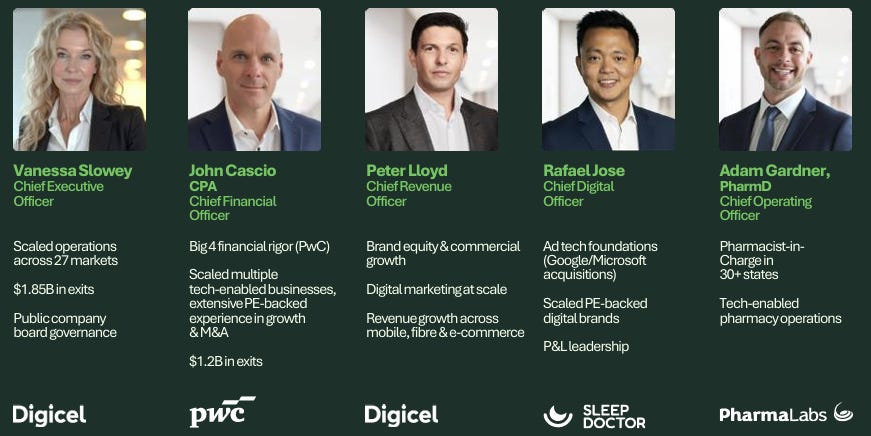
Vanessa Slowey, CEO (since November 2025).
Slowey is the real deal operationally: ~15 years at Digicel, founding CEO of Digicel Asia Pacific for eight years, then CEO of Digicel’s Caribbean and Central American operations (a ~$2.1B revenue P&L across 27 markets). She grew up working in her parents’ pharmacy in Ireland, which makes for a tidy narrative arc.
At the investor conference on June 4 she said: “I built Digicel Pacific and sold that to Telstra for $1.85 billion.” The transaction is real, Telstra acquired Digicel Pacific in a deal announced October 2021 and closed July 2022, valued at up to US$1.85 billion, which includes a US$250M three-year earn-out on a US$1.6 billion headline price (the management circular itself uses the $1.6B figure; the deck and her verbal pitch use $1.85B). But Slowey left Digicel in september 2018, more than three years before the sale was agreed, however she was still a director during the time and had to approve the transaction. She built the business; she did not sell it. “Built the asset that someone else later sold for $1.85B” is a meaningfully different sentence from the one investors hear on stage.
Two further layers of context the pitch omits is first, the price itself wasn’t a market-clearing valuation as Telstra contributed only US$270M of equity, while the Australian Government, through Export Finance Australia, financed US$1.33 billion of the US$1.6B price plus political risk insurance, explicitly to keep the Pacific’s dominant telecom out of Chinese hands. The asset quality was genuinely hers (PNG built from zero to ~90% share; US$466M revenue and ~US$222M EBITDA at a 54% margin at sale, a frontier-market build few operators can match), but the 8.3x EBITDA price owed a lot to geopolitics and Canberra’s chequebook.
Lastly, the Digicel she left behind tells its own story, after her september 2018 departure as ceo, the group went through a 2020 restructuring writing off $1.6B of a $7B debt pile, then a 2023 restructuring writing off another $1.7B that handed bondholders ~90% of the company, founder Denis O’Brien fell from 99.9% to ~10%. That collapse was a capital-structure failure (leveraged dividend extraction), not an operating one, and it happened on others’ watch, but her cited “$2.1B P&L” was the Caribbean region at the heart of the decline, and she ran it for roughly two years, which is not quite the “Group CEO of Digicel” the circular implies.
John Cascio, CFO.
“Big 4 financial rigor (PwC), $1.2B in exits.” Cascio was a senior associate at PwC, then VP Finance at Red Ventures (a legitimately large PE-backed digital commerce operator), CFO of ACI Learning, and CFO of OnwardMobility a startup that licensed the BlackBerry brand to build a 5G phone and shut down in early 2022 without ever shipping a product. I could not find public substantiation for the “$1.2B in exits” figure; it may relate to Red Ventures-era or ACI transactions, but it is not verifiable, and OnwardMobility is conspicuously absent from the highlight reel.
Peter Lloyd, CRO.
Former Global Chief Marketing Officer of Digicel Group i.e., Slowey’s ex-colleague, making the commercial core of this team a Digicel reunion rather than pharmacy veterans. Peter has 15+ years experience of scaling brands and revenue engines across 32 countries, a seat on Digicel’s executive leadership team shaping global commercial, brand and customer-experience strategy across consumer and enterprise segments, and leadership of the group’s brand transformation and repositioning into a digital-first operator at a telco doing ~$2B in revenue. Digicel’s playbook was selling a recurring, commoditized service to mass-market consumers on brand and distribution rather than product differentiation which is, structurally, exactly the cash-pay generics problem. What he hasn’t done is US healthcare; the bet is that brand mechanics transfer and the regulatory layer is someone else’s job.
Rafael Jose, CDO.
Given that the binding constraint on this business is the price of attention, Jose arguably matters more than anyone except the founders. The verifiable record is a two-decade career in exactly the discipline TelyRx runs on, performance marketing where the unit economics are measured per click. He has four years experience as Chief Digital Officer at SleepDoctor.com (a DTC sleep-health platform monetizing search intent into product and diagnostics revenue, presenting a near-perfect dress rehearsal for cash-pay pharmacy) and six years as Chief Content Officer at HigherEducation.com, the education lead-generation machine that connects student search traffic to universities, one of the most ruthlessly measured arbitrage businesses on the internet. One caveat for the record is that the deck’s “ad tech foundations (Google/Microsoft acquisitions)” claim presumably refers to early-career employers (he is Seattle-based, so the aQuantive/Microsoft lineage is plausible), but I could not confirm it from public source which is consistent with this deck’s pattern of real substance, maximal framing.
Adam Gardner, PharmD, COO.
Pharmacist-in-charge licensed in 30+ states and quietly the most load-bearing person in the company. Many states tie a non-resident pharmacy license to the PIC being personally licensed there, so Gardner’s licensure is plausibly the legal anchor under much of the 48-state map; the “license stack” is partly attached to one human being. If he left, expect PIC-change filings, some re-applications, and a hard search. Pharmacists already licensed in 30+ states are rare, and rebuilding via reciprocity takes a year or more. Painful, not fatal (home-state licenses persist, the second site has its own PIC), and cheaply insurable by licensing two or three staff pharmacists in parallel, a disclosure worth watching for in future filings.
Verdict on management is that they are a capable, commercially serious team with genuine scaling experience in regulated industries, but the exit figures are aggregated, rounded up, and in the CEO’s case attributed in a way that overstates personal involvement. Stellar execution since launch (they forecast $9.6M year-one revenue and delivered $9.5M; targeted $40M in year two and delivered $43M) earns them credibility the deck’s framing doesn’t. My internal key-person ranking: Gardner first (structural, insurable), Jose second (the Cosumter Acquisition Cost(CAC) Engine ), Slowey third (credibility, most replaceable operationally).
Diagram 8: Previous Ceo and Co-Founder of TelyRx (Statement)
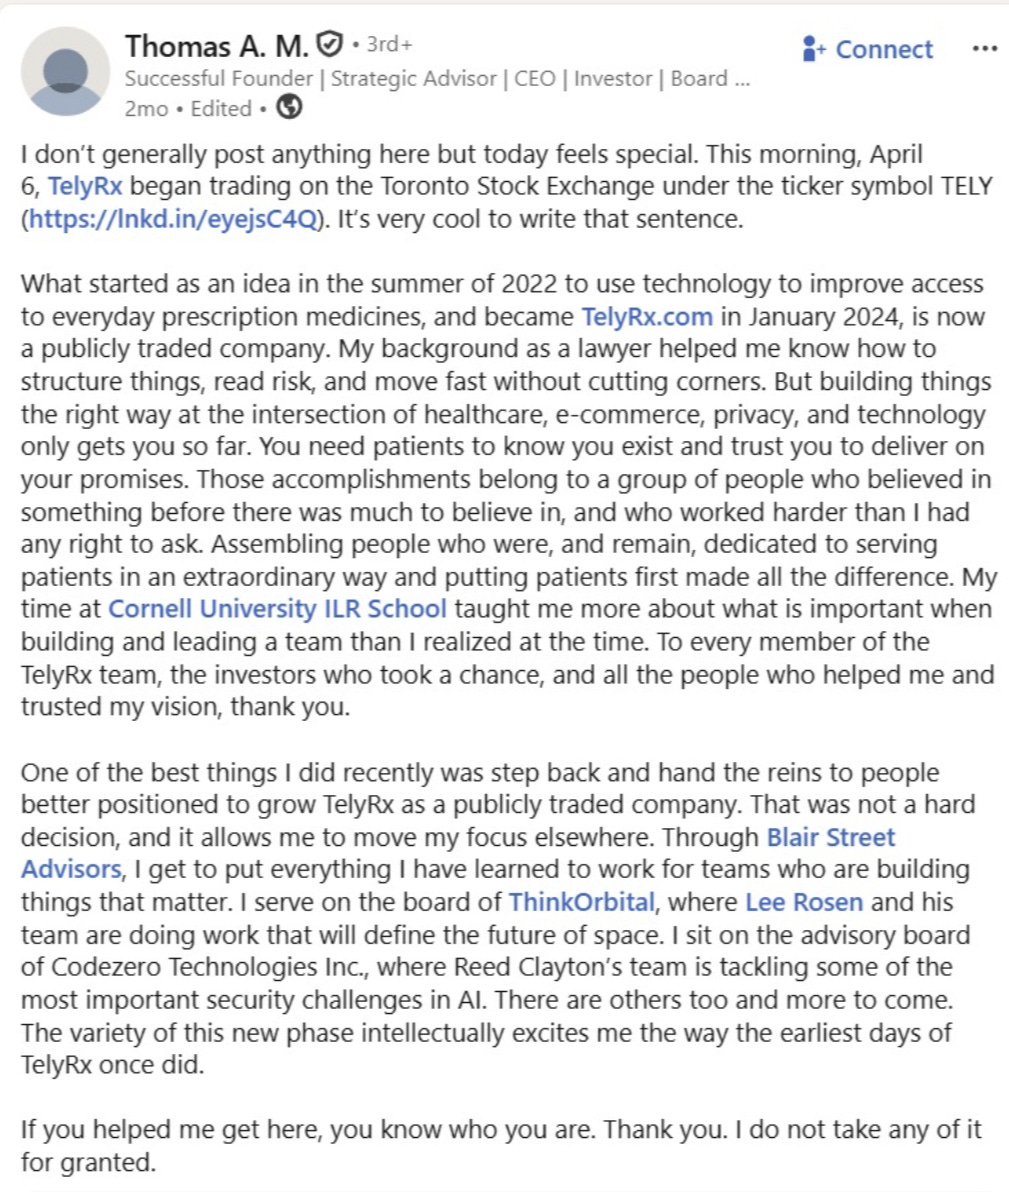
One more note is that the co-founder Thomas Mckinney(former healthcare lawyer) ran the company until November 2025. The MD&A discloses an October 31, 2025 severance and release agreement with the current CEO, settling change-of-control compensation. Slowey was brought into the company in March of that year as the incoming ceo, thus there was a transitional period up until November 2025 when she would finally be installed as the ceo, since her skills are better suited for the next wave of growth.
The Board
It is positioned better than the microcap norm; Ransom Langford (15 years a Partner at TPG), Robert Sean Foley (ex-CFO of MUFG Investor Services, ex-EY/Deloitte), Michael Handler (ex-SAC Capital, ex-CFO of the City of Stamford), Dr. Kenneth Bernard (Yale/Harvard MD-MBA, Chief Clinical Officer at UVA Community Health), and Andrew Brandt (software engineer/entrepreneur). They have Clean records, no cease trade orders, bankruptcies or sanctions disclosed as well as four of six are independent.
Compensation is quite high as non-employee directors get US$195,000/year in base compensation (US$115k cash + US$80k RSUs) which is rich for a company this size plus one-time RSU grants of up to 154,644 RSUs each. CEO Slowey holds 1,221,260 RSUs (~2.5% of the company), one-third of which vested immediately on grant. Management in general has no equity, except the RSU shares as the A
Share Structure, the RTO, and the Coming Unlocks
TelyRx went public via reverse takeover of Apolo V Acquisition Corp., a TSXV capital pool company whose principals Ryan Roebuck (seed investor and founding board member of what became Cronos Group), Michael Galego, Michael Young (board of ICC Labs, sold to Aurora; founding shareholder of Nuuvera, sold for ~C$550M) and Jeff Hergott are serial Canadian shell/promote financiers, mostly from the cannabis cycle.
Their CPC track record is checkable and mixed as Apolo I became CryptoGlobal, which was sold all-stock into HyperBlock in 2018, afterwards HyperBlock collapsed in the crypto-mining bust, largely wiping those holders. Apolo III became Playmaker Capital, acquired by Better Collective in early 2024 for ~$188M at C$0.70 which represent a 46% premium and a genuinely good outcome for the investors.
A detail that jumps out of the Apolo prospectus is that the shell’s 19.0M seed shares were heavily placed with Grand Cayman residents such as the Crighton family (25% as a group), the Swartouts, the Kirkconnells, Hareshkumar Chandi, plus entities like Black Gold Investment Holdings and HCS Cayman Ltd. Crighton and Kirkconnell are established Cayman merchant families, so this reads as the Toronto promoters tapping a Cayman money network to seed the CPC.
Diagram 9: Major Shareholders Estimated
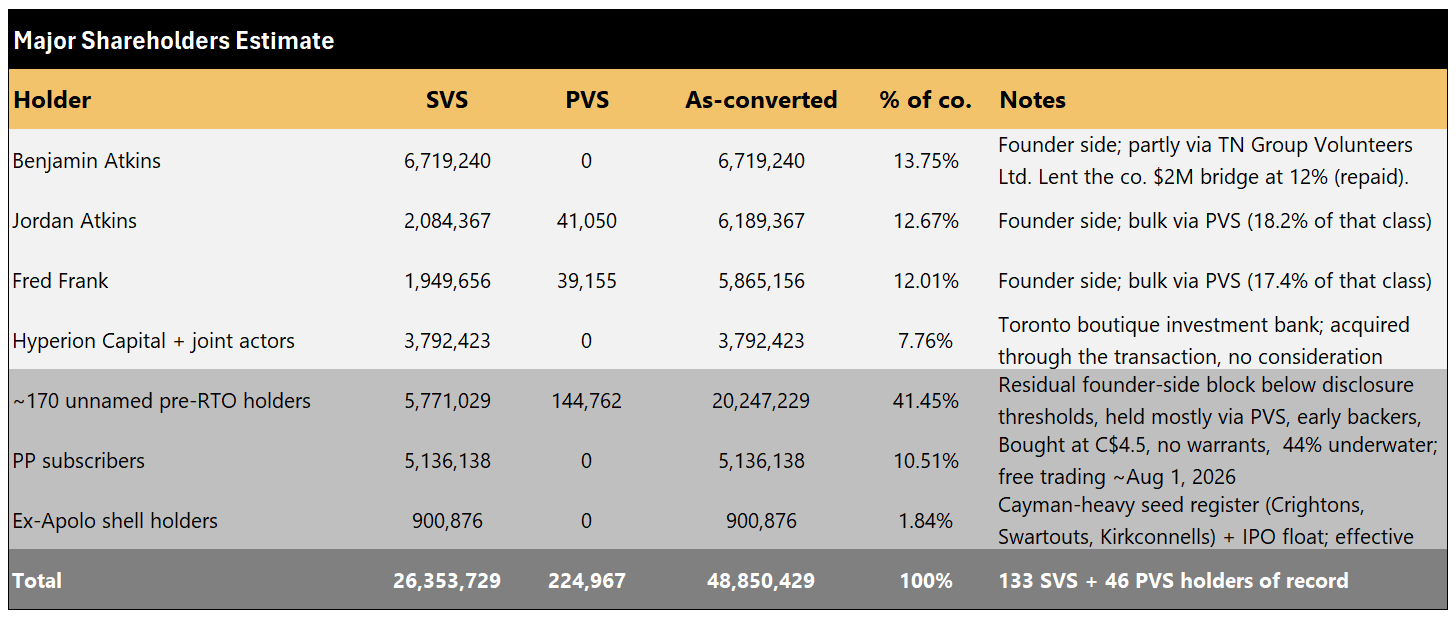
The Atkins as well as Fred played a major role for providing the capital, wile co-founder Thomas Mckinney provided the operating business foundation. There are legitimate reasons stock sits there (zero capital gains tax, and the operating Cayman connection is real as CEO Slowey and director Foley genuinely reside there via the Digicel orbit). I want to add that the current management has a bit more than 1% of the outstanding shares and most of their equity comes from the issuance of RSUs(which would get them to around 3-4%).
The mitigating fact is that the 30-to-1 consolidation de-fanged the entire shell crowd. All 27M Apolo shares became 900,876 shares representing 1.8% of the company, with seed stock at an effective post-consolidation cost of ~C$1.50. The Cayman shell cluster is an optics issue, not an overhang. The promoters kept post-consolidation options struck at effective C$1.50 - $3.00 equivalents and exited the board at closing.
The Hyperion block deserves its own paragraph. Hyperion is not an operating shareholder, it is a Toronto boutique investment bank (formed 2020, cannabis-sector specialty) whose early warning release (May 8, 2026) discloses that it, “together with parties who may be considered joint actors,” acquired control and direction of 3,792,423 SVS at closing representing a 14.39% stake of the liquid share class.
The release is precise about one piece and conspicuously silent on the other before closing, Hyperion itself held zero TelyRx securities, and one joint actor held just 3,333 SVS (100,000 Apolo IPO shares bought at C$0.10, total outlay C$10,000). The other 3,789,090 shares were acquired through the Transaction steps themselves and no consideration paid is stated anywhere in the release. They were PP subscribers, however only 166,910 shares worth C$751,095.
The realistic reading is that pre-RTO TelyRx equity exchanged in the amalgamation, advisory/finder compensation, or aggregated client stock cost basis is structurally near nil.
Diagram 10: Capital Structure, and Potential Dilution
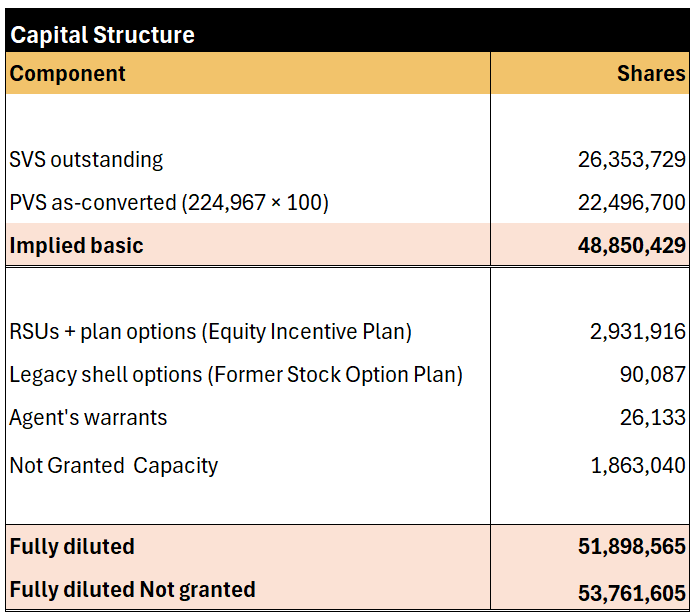
The related-party history also deserves a mention, though on inspection it cuts the other way the company’s original $5.5M credit facility came from a shareholder (FL Pharma Investment Group, "a shareholder of the Company" and its parties "are also shareholders") at prime + 7.50%, a December 2025 bridge loan came from Benjamin Atkins at $2.0M with a rate of 12% plus a 2% origination fee, and one of the two pharmacies is leased from an entity partially owned by a shareholder. At first glance this looks like self-dealing. But the rates were roughly market for unsecured pre-IPO startup risk, the founders were bridging their own company with personal capital when no bank would, and the moment a bank would (Waterfall, January 2026, 6.5% fixed), all insider debt was repaid in full. Founders who lend at 12% instead of issuing themselves cheap equity are telling you they think the equity is too valuable to print which brings us to the most important structural question.
Share Unlocks
Anyone deciding whether to buy TELY today is really deciding when to buy it, because the next eighteen months are a pre-published schedule of share supply. The escrow terms from the filing statement are the standard TSX value escrow, 25% released on the Final QT Exchange Bulletin (March 31, 2026), then 25% at each of the six, twelve and eighteen-month anniversaries.
Diagram 11: Unlocks for Escrows
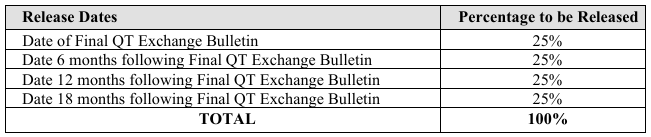
Applied to the cap table, that produces the following free-trading waterfall. The founder block (~36.2M as-converted shares excluding Hyperion) sits at a blended cost basis of roughly C$0.55 per share -(w the original 2022–23 founders are in around C$0.22, the 2024 contribution round at ~C$1.33, and ~5M shares were stock compensation at zero cost. The PP investors paid C$4.50. That spread in cost basis, not the share counts, is what determines how each wave behaves
Diagram 12: Share-Release Schedule
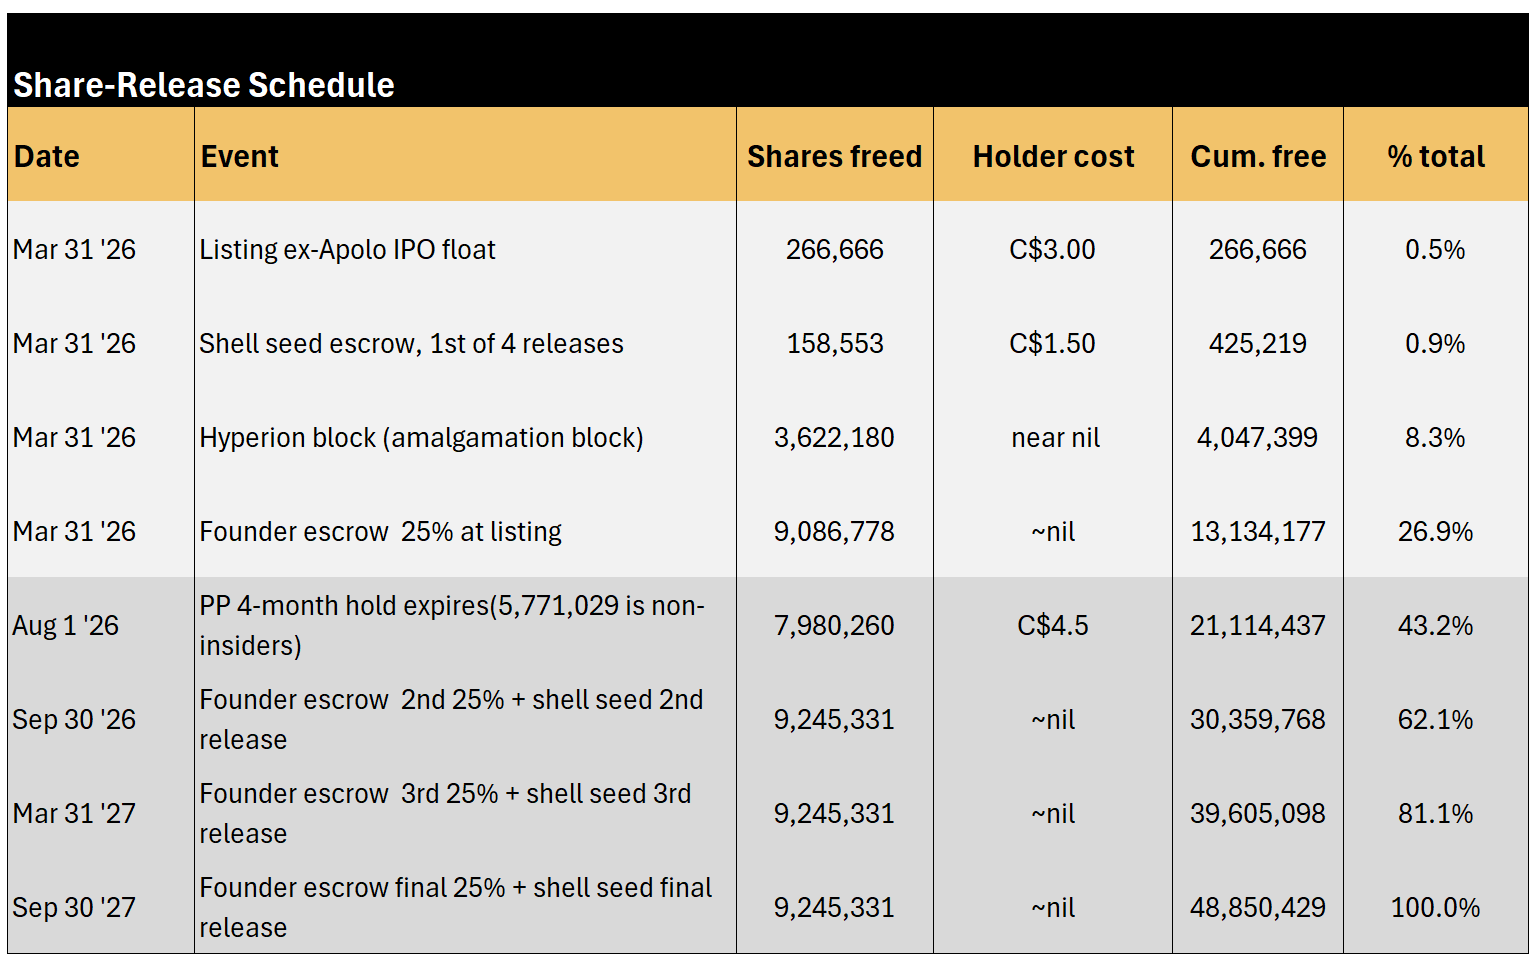
My expectation is that between the August PP unlock and the September escrow release, the share price likely takes another beating in the next 2–4 months. For anyone who likes the business, that is a feature, not a bug.
Will Management Dilute You?
Since ~82% of this company sits at near-zero cost basis, it’s worth mapping exactly where the cheap stock is:
TelyRx founders: ~36.2M of the 48.85M implied shares at a blended ~C$0.55.
The 17.5M SVS plus the 22.5M shares underlying the PVS went to pre-RTO holders. The equity statement in the annual financials shows what was actually paid in is US$15.9M of total share capital across 10.69M pre-RTO shares (each became ~3.74 TELY shares). Within that blend the original 2022–23 founders are in at roughly C$0.22 per TELY share, a 2024 contribution round paid US$6.5M (~C$1.33 per TELY share note that’s what insiders paid before revenue grew 4.5x; the market today asks less than 2x that), ~5M TELY-equivalent shares were stock compensation at zero cost, and a small debt conversion came in around C$1.95. Growth itself was financed with shareholder loans at up to 12% rather than further equity.
Hyperion’s 3.8M shares likely free trading since day one.
Per its own early warning release, Hyperion held nothing in the listed entity before closing (one joint actor held 3,333 SVS, a C$10,000 position) and acquired the block through the Transaction steps with no consideration disclosed structurally near-zero cost. Because the shares almost certainly came via the merger leg rather than the placement, they likely carry no four-month hold and no escrow (Hyperion is under 10% of votes with no board seat). Above 10% of the SVS class, each ~2% decrease forces a new SEDAR+ filing, so their selling is trackable.
The shell remnants
900,876 shares at effective C$1.50-$3.00. Trivial.
The PP at C$4.5 is the one block that is not cheap
those 7,980,260 shares at C$4.5 which raised $35,911,170 CAD are severly underwater, an overhang of liquidity-need sellers rather than profit-takers. If we take into account insiders, the PP was only 5,136,138 valued at 23,112,621 CAD:
So is management pro-shareholder, or will they dilute endlessly? The four-year capital history gives an unusually clear answer. They financed 350%+ annual growth with founder loans at 12% rather than print equity. There has been exactly one equity raise ever, done at the C$4.5 top tick, with no warrants attached. Total options and warrants outstanding: ~116,000 shares which is effectively nothing. The business burns almost no cash, holds $27M, and can more than double revenue on existing capacity, so no forced financing. Founders held ~40% through the listing and took no disclosed secondary.
The realistic dilution is not financings but compensation as the evergreen 10% plan, the CEO’s one-third-on-grant RSU vest, US$195k director retainers. Call it 2–3% annual dilution plus ~$1.2M of cash board comp, they notably did not max out the pool at listing. The tell to watch is whether the plan gets topped up aggressively or awards get repriced; either would change my read. Management only has an equity position due to the Restricted Share Units, otherwise major Insiders own the bulk.
TelyRx in Numbers
A quick note on the general analysis is that unless stated otherwise, all figures are in US dollars and drawn from TelyRx's Q1 2026 interim financial statements and MD&A (three months ended March 31, 2026, released May 12), supplemented by the June 2026 investor deck, the management information circular, the Apolo V prospectus, and the May 13 earnings call.
Income Statement
TelyRx’s Q1 2026 income statement is a textbook case of why growth-stage P&Ls mislead at first glance. On the surface there is a $4.7M net loss, widening from breakeven a year ago. Underneath we can see a business whose entire loss is composed of two items it chose, a one-time accounting charge for going public, and a marketing budget it could cut to zero tomorrow as its a variable cost. Lets take a look at the revenues.
Diagram 13: Revenues
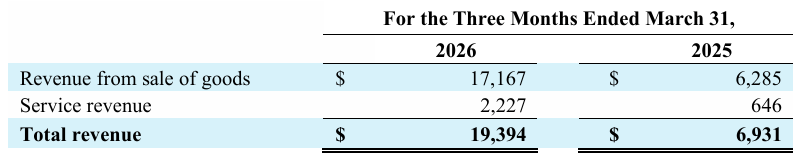
Revenue is $19.4M in Q1 2026, up 180% year-over-year and 35% which is split the revenue into two lines that is the $17.2M from sale of goods and $2.2M of service revenue. The labels are narrower than they sound, per the accounting notes, the $22 physician review fee is recognized as an extension of the product sale (it sits inside goods revenue), while the service line is specifically shipping and handling fees.
Diagram 14: Revenues for New & Recurring Customers
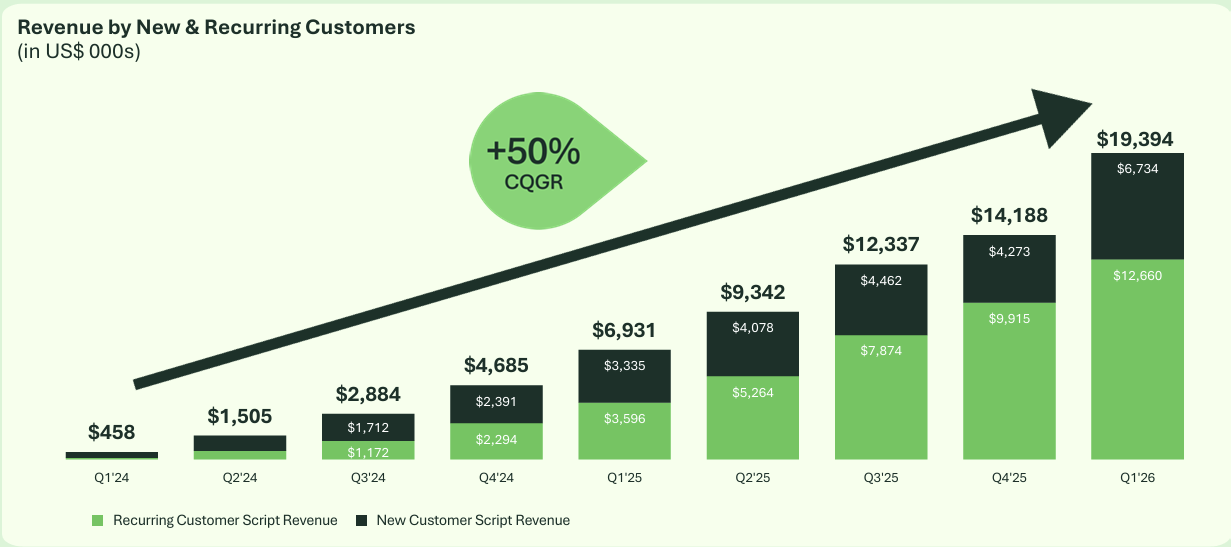
The quarterly series since launch ($0.46M in Q1’24 to $19.4M nine quarters later) compounds at roughly +50% per quarter, and the composition is the part that matters as $12.7M (65%) came from recurring customers(refill), $6.7M from new ones. The recurring layer is the annuity the marketing spend has been buying and it alone now exceeds total revenue from just two quarters ago.
Diagram 15: Cogs, Revenues, Gross Profit

Gross profit was $10.7M at a 55% margin, up from 50% a year ago driven by direct-from-manufacturer purchasing, better negotiated wholesale pricing, lower per-order card processing fees, and improved shipping margins. Management points to ~70% margins on much of the formulary and expects scale to push the blend higher.
Diagram 16: Operating Loss

Operating expenses were $13.6M, having a look at G&A it grew quite substantially nearly four times to $13.3M as there is a ramp-up in several costs as is seen below. Depreciation and amortization is $252k showing the capital-light model that Telyrx has. Taking a look at he G&A more specifically, this is where the investment thesis lives as advertising and marketing was $8.1M presenting 61% of all operating costs up from $1.5M a year ago, which is a deliberate 5.4x increase in acquisition spend. The chart below highlights a significant shift in the company’s cost structure, with marketing growing from approximately 20–22% of SG&A in FY24 to nearly 60% by FY26E.
Diagram 17: Marketing Spend of S&&A (Golden line is a 4 Quarter Moving Average)
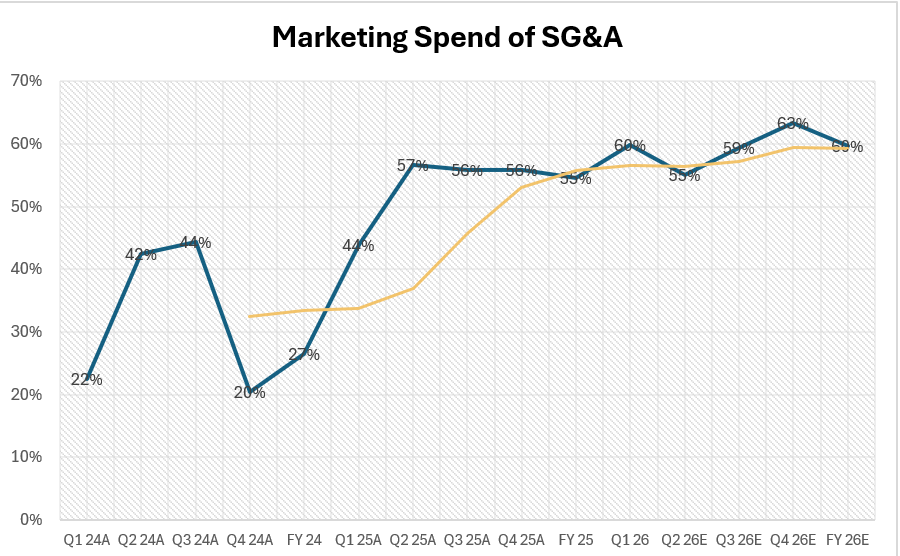
This indicates that recent expense growth has been driven primarily by customer acquisition and growth initiatives rather than administrative overhead. As the business matures and recurring revenue becomes a larger share of total revenue, the company may be able to moderate marketing intensity, allowing a greater portion of revenue to flow through to earnings. Having a further look at the cost structure of Q1, Salaries were $3.2M (up with headcount), legal and professional fees $0.7M (mostly listing-related, non-recurring in size), software $0.4M, stock comp a modest $0.2M.
Diagram 18: SG&A Breakdown
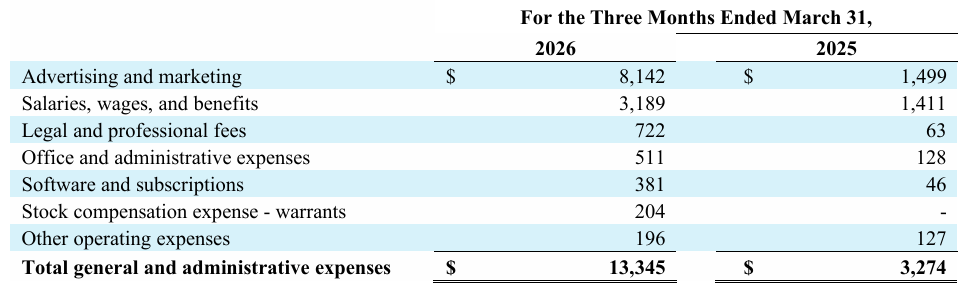
Strip it apart and the structure becomes obvious as before marketing, the business earned roughly $5.2M of operating profit in the quarter ($10.7M gross profit less ~$5.5M of non-marketing opex). The reported $2.9M operating loss exists because management chose to spend $8.1M acquiring customers who pay back in three months. The loss is not a cost of running the business; it is the price of buying next year’s recurring revenue, and it can be dialed to zero or heavily decreased in a quarter if needed.
Diagram 19: Bottom-line
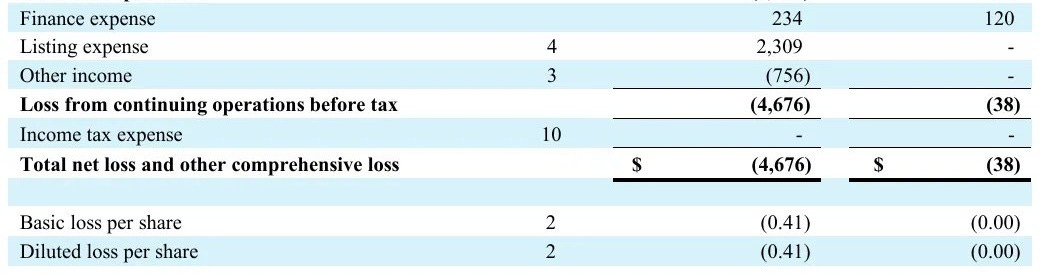
In terms of profits, the headline net loss of $4.7M (–$0.41/share) is further inflated by a $2.3M one-time non-cash listing expense, partially offset by $0.8M of other income which is also one-time. Finance expense was just $0.2M on the cash-collateralized bank loan, and income tax nil. Taking into account the potential one-time expenses we get around $3M in losses. The potential tax pools to be exhausted are approximately $6-8M, which in the future could present less than a year.
In summary we have a 55%-margin, working-capital-free machine earning ~$5M a quarter before growth spend, currently choosing to reinvest more than all of it into customer acquisition at a measured 3-month payback as they should, beyond that they have a one-time items included.
Balance Sheet
Lets start with the balance sheet so Cash and equivalents present $27.0M. This is because of the Capital raising activites, thus being 79% of total assets which means that the balance sheet is mostly a pile of money with a pharmacy attached. However, the one caveat is that in April, the $10.2M was deposited as collateral for the term loan, so freely deployable cash is ~$17M, plus $0.5M in restricted Certificates of Deposits.
Diagram 20: Assets
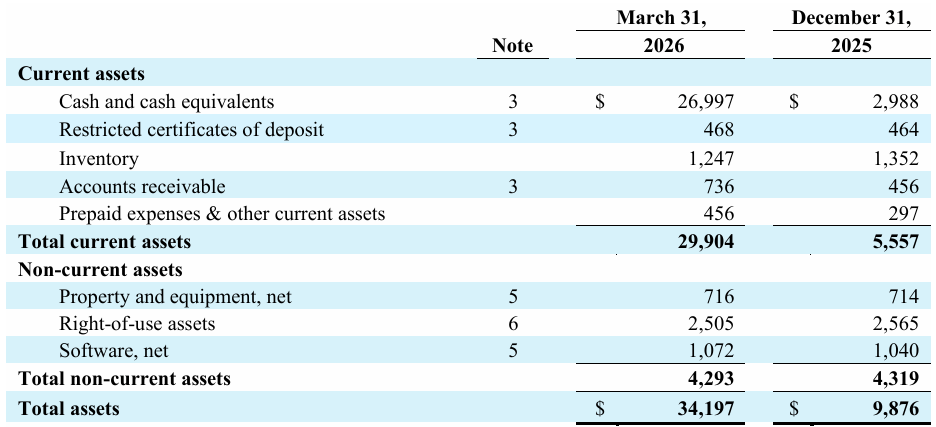
Inventory is $1.2M which is thirteen days of cost of revenue, the formulary turns nearly 28x a year. For a “pharmacy,” there is almost no capital sitting on shelves, and inventory actually fell while revenue grew 35% sequentially. Accounts receivable are only $0.7M ($0.5M) which is his is 3.4 days of revenue, and it shows that customers pay by card before the box ships. Compare any insurance-billing pharmacy, where receivables run 30–60 days and carry clawback risk. There is functionally nothing to collect and no one to collect it from.
Total current assets are $29.9M against current liabilities of $7.7M ($15.8M) showing a current ratio of 3.9x, adjusting for the collateral part we are still above 2x representing a healthy current ratio and there is a working capital of+$22.2M. Non-current assets are $4.3M of which Equipment of $0.7M and $1.1M of capitalized software the entire productive plant of a $330M-capacity operation plus $2.5M of right-of-use assets for the two leased buildings. Tangible fixed assets are around 10% of the total assets.
Diagram 21: Liabilities & Equity
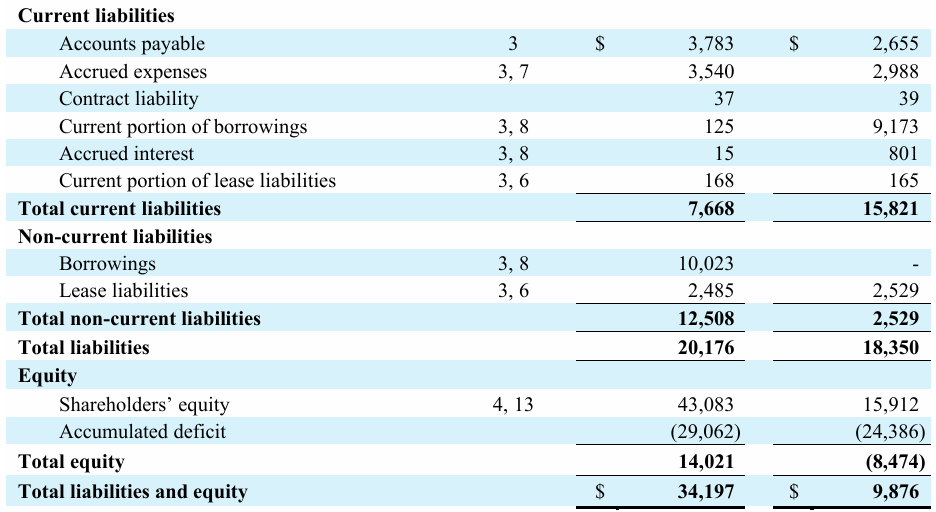
The liability side shows payables of $3.8M run at ~39 days against 3-day receivables and 13-day inventory, that’s a cash conversion cycle of roughly minus 23 days as TelyRx collects from customers three weeks before paying suppliers, so growth generates float rather than consuming it. Accrued expenses of $3.5M representing the liabilities owed to stakeholders(from marketing expenses, compensation to taxes payable). Lease liabilities are around $2.7M for the facilities. In regards to the debt there are just $125k of borrowings which are current, taking a look at the December column it showed $9.2M current debt plus $0.8M accrued interest (the insider loans mentioned with accured interest and the bridge loan, all repaid). These were replaced by a single $10.0M non-current term loan at fixed 6.5%, maturing 2031, no principal on year one, fully cash-collateralized. Overall Net debt is effectively zero. Lease liabilities of $2.7M round out the picture.
Equity is at $14.0M as share capital jumped from $15.9M to $43.1M (the $23.8M net placement plus the deemed value of the shell), against an accumulated deficit of $29.1M which is the cumulative cost, to date.
Cash Flow
Operating activities are -$1.3M (vs +$0.1M a year ago). Starting at the top we can see a $4.7M net loss, then $2.8M of add-backs of which $2.3M is the non-cash listing expense and $0.2M stock comp; actual D&A is just $252k. In terms of working capital, there was an increase of +$1.6M , as payables (+$1.2M) and accruals (+$0.7M) scaled with the business while receivables barely moved (-$0.3M) and inventory actually released cash (+$0.1M). That’s the negative cash-conversion cycle in action. In terms of interest paid there was around $992k which looks alarming against a 6.5% loan, but most of it was the one-time settlement of accrued payment-in-kind interest on the retired insider loans (the December balance sheet carried $0.8M of accrued interest, cleared at refinancing). The ongoing interest run-rate is ~$165k a quarter. Normalize for that catch-up and underlying operating cash flow was roughly -$0.5M.
Diagram 22: CFFO
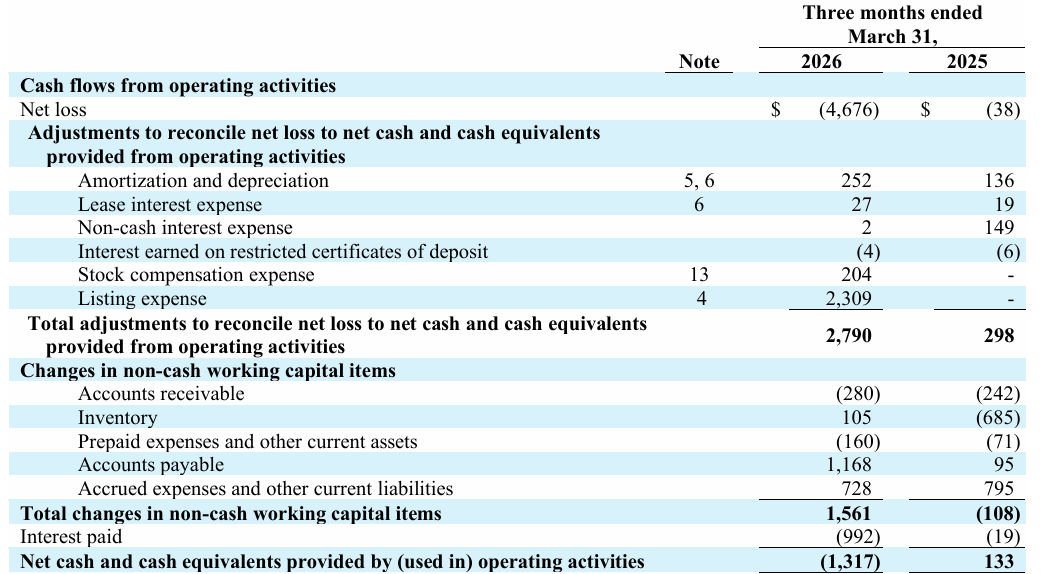
Investing activities were +$0.6M yes, positive. Capex was a grand total of $225k ($38k equipment, $187k software) for a company growing at this rate, essentially nothing, but the line is swamped by $827k of cash acquired in the reverse takeover (the shell’s till). Note that the company’s own “Free Cash Flow of –$715k” nets that RTO cash into the calculation; computed cleanly (operating CF minus actual capex), FCF was –$1.5M, or roughly –$0.7M after normalizing the interest catch-up. Same conclusion, but worth knowing their headline FCF got $0.8M from the shell’s.
Diagram 23: CFFI, CFFF, FCF
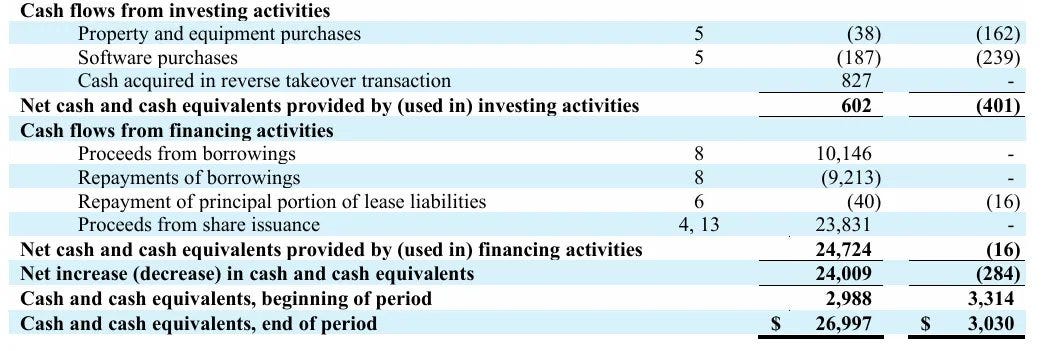
Financing activities are+$24.7M. The quarter’s main event in four lines was$23.8M of net share issuance (the placement), $10.1M drawn for the loan, $9.2M of insider debt repaid, $40k of lease principal. The entire related-party debt complex, which was there to fund growth as well as conduct the RTO as fast as possible. Net result is that cash is up by $24.0M in the quarter, from $3.0M to $27.0M.
The verdict on burn is that there are three ways to measure it, in increasing harshness actual normalized burn ~$0.5–0.7M per quarter (the clean run-rate); the underlying P&L loss ex-one-timers, ~$3M per quarter if working capital ever stopped helping; $8.1M of the quarter’s spending was discretionary marketing with a three-month payback that could be halted by at any/time or heavily decreased. This is against ~$17M of unencumbered cash (plus the $10.2M collateral backing an equal loan), even the harsh measure gives two-plus years; the realistic one gives the better part of a decade; and the outlook has FCF turning positive ($0.6M) within the year. The honest summary is that this is not a cash-burn story at all, it’s a company spending its own gross profit, plus almost nothing else, to compound a recurring customer base, with a war chest it raised.
Unit Economics
The whole company reduces to one transaction table, so start there.
Diagram 24: Average Transaction & P&L
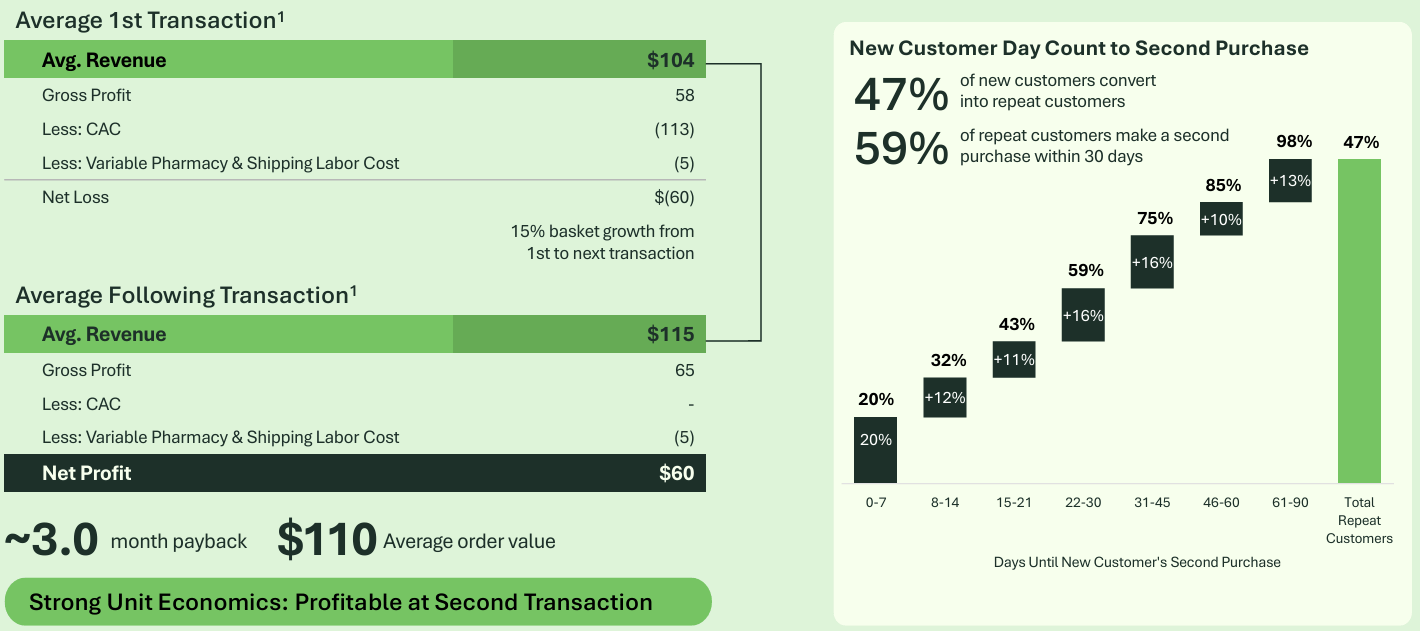
The average first order is $104 of medication, the flat $22 review fee, as well as shipping. At a 55% gross margin that’s $58 of gross profit, against ~$113 of customer acquisition cost and $5 of variable fulfilment labor so TelyRx loses about $60 on every new customer it acquires. This is the entire reported loss of the company in miniature, and it is deliberate. The repeat transaction is the same trade with the sign flipped as the baskets grow ~15% to $115, gross profit $65, CAC zero thus $60 of profit per order. Every customer is a coin that costs $60 and pays $60 per flip; the business case is simply how often it flips.
The right-hand chart answers that. 47% of new customers come back at all and of those who do, 20% are back within a week, 59% within 30 days, 98% within 90. Payback on the acquisition cost arrives in roughly three months. For comparison, consumer subscription businesses celebrate 12-month paybacks; this is a quarter.
Diagram 25: Lifetime Revenue per Customers
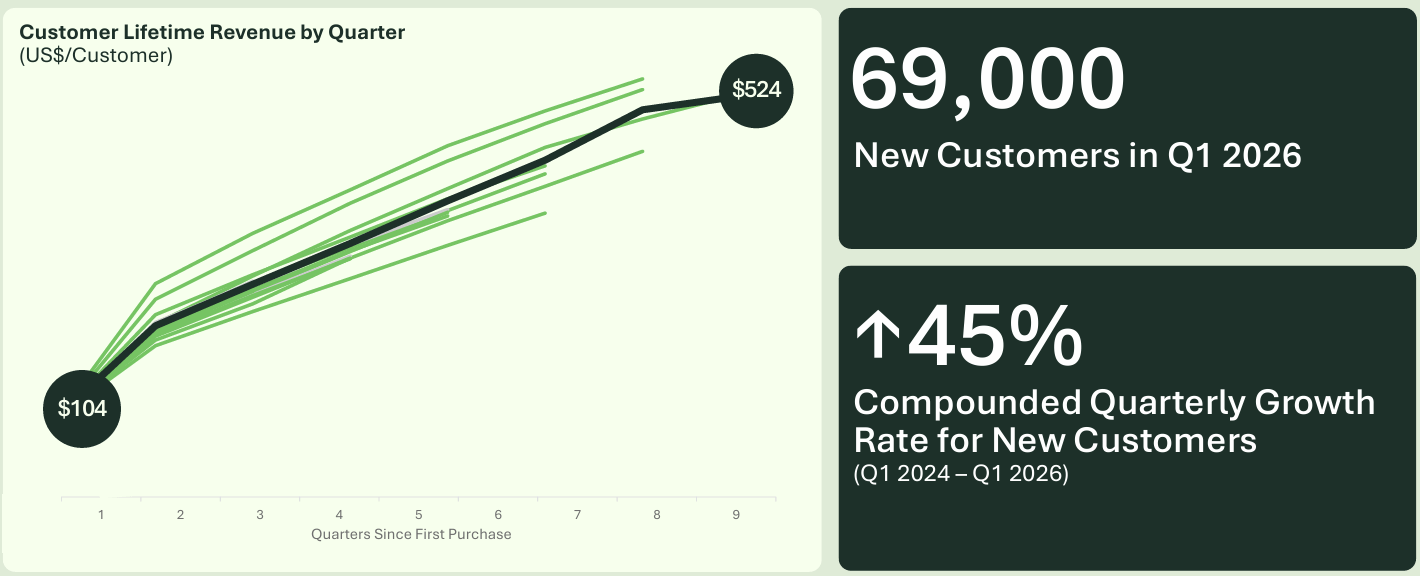
The cohort chart is, to my eye, the single most important slide the company publishes. Nine quarterly cohorts, nine nearly identical curves as $104 on day one, compounding to $524 of lifetime revenue for the oldest (Q1’24) cohort after nine quarters and still rising at the right edge. The consistency is the point as cohort two behaves like cohort one, cohort nine like cohort two, which means the $8.1M spent on marketing last quarter bought an asset whose payout schedule is, on two years of evidence, predictable. 69,000 new customers joined in Q1 2026 alone, thus the new customer intake has compounded at 45% per quarter since launch.
Two honest qualifications before the applause is that the company quotes 4.3x LTR/CAC note that’s lifetime revenue over CAC; on the gross-profit basis most operators use for LTV/CAC, it’s $524 × 55% ÷ $113 ≈ 2.5x, and rising as cohorts continue to accrue which is healthy.
Diagram 26: Return on Marketing Spen
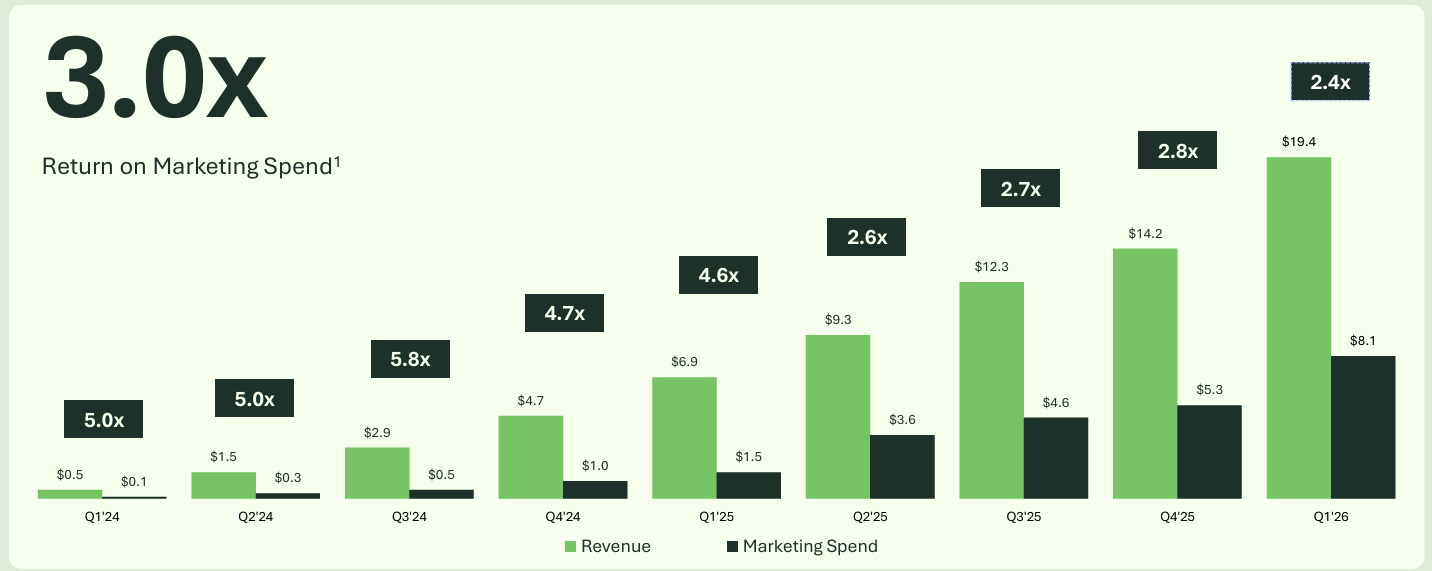
Which brings us to the chart that deserves the most scrutiny. The headline says 3.0x return on marketing spend; the bars underneath it decline from 5.8x in 2024 to 2.4x in Q1 2026. The headline is the inception-to-date average, the current quarter is the lowest ever printed. Part of this is honest arithmetic rather than deterioration as the ratio divides this quarter’s revenue by this quarter’s spend, but each quarter’s spend buys customers whose revenue arrives over the following two-plus years. When spend grows 5.4x year-over-year, the denominator fills with brand-new customers who haven’t compounded yet, thus a fast-scaling cohort machine will always look worst on this metric exactly when it’s investing hardest. Part of it, though, is a real thing as cheap keywords get exhausted first, and management itself guides to rising blended CAC as channels diversify. Their stated target is exiting 2026 around 3.5x; Q1 CAC came in favorable to plan. This is the single most important number to watch each quarter, if ROAS stabilizes in the high-2s while cohorts keep tracing the same curve, the model works at scale; if it keeps sliding toward 2.0x with no cohort improvement, the flywheel is grinding, and everything else in this article matters less.
The summary in one sentence is that TelyRx buys customers at a ~$60 first-order loss, recovers it in three months, and owns an annuity tracing a $524-and-rising curve a machine whose only real question is the rising price of its fuel(marketing).
The Outlook
The go-public plan is specific enough to be auditable, which is rare and welcomed. The headline targets for 2026 to have $113M revenue (+163%), 56% gross margin, $59M of operating expenses, $4M of adjusted EBITDA and $0.6M of operating FCF. The quarterly build behind it is $18.3M → $23.0M → $31.1M → $40.1M as seen below, with return on marketing spend climbing from 3.2x in Q1 to a 3.5x exit rate in Q4 on $33.5M of full-year marketing.
Diagram 27: Outlook
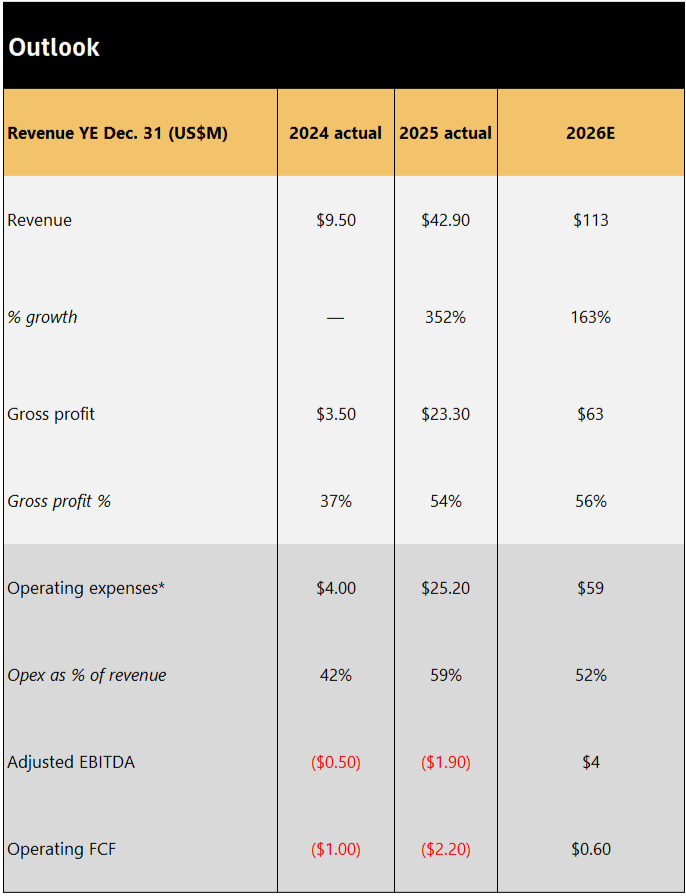
One quarter in, the scorecard is genuinely mixed and more interesting than the headline beat suggests.
What they beat was the total Q1 revenue of $19.4M against a planned $18.3M, +6%. New customer revenue came in at $6.7M versus $5.0M planned, a 35% beat as the acquisition engine over-delivered.
Diagram 28: Revenue Forecasts
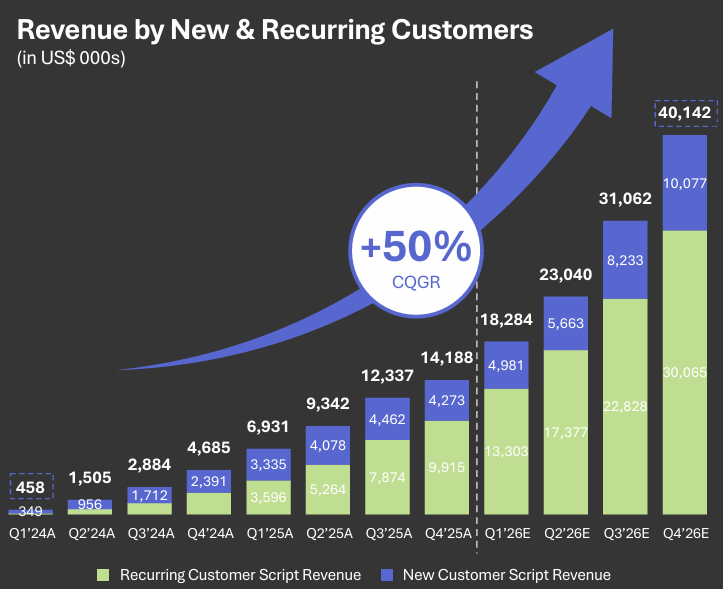
Where they missed is two things, and they’re connected. Recurring revenue printed $12.7M against $13.3M planned a 5% miss on the one line that’s supposed to be predictable and the beat was bought as marketing spend ran $8.1M against $5.8M planned, 40% over budget, which is why ROAS landed at 2.4x against the 3.2x the plan called for. The retention base compounded slightly slower than modeled, and management leaned on the (working) acquisition engine to cover it hitting the topline by spending through the plan.
Diagram 29: Marketing Return Forecast
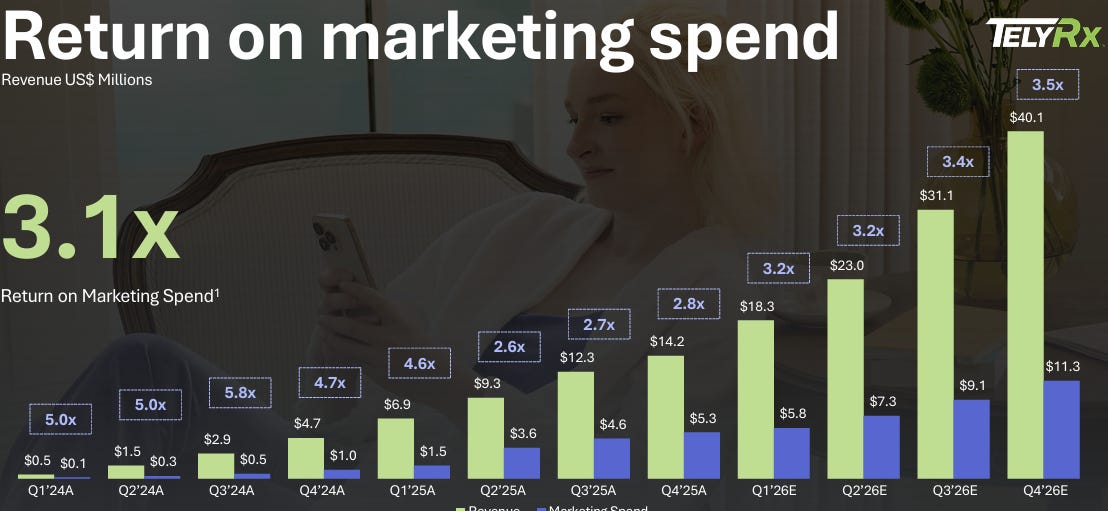
That trade-off frames the real question for the rest of 2026, and it’s worth doing the arithmetic out loud. The remaining three quarters require ~$94M of revenue on ~$27.7M of planned marketing an implied ROAS of ~3.4x. If ROAS stays at Q1’s 2.4x instead, there are only two doors tohold the revenue target and spend ~$39M (≈$12M over plan, vaporizing the $4M EBITDA guidance into a high-single-digit loss), or hold the spending plan and land somewhere near $85-90M of revenue (a ~20% miss on a stock priced off this number). The $4M adjusted EBITDA target is only achievable if ROAS recovers most of the way to plan.
The bull’s rebuttal is mechanical rather than hopeful as ROAS should improve from here without any marketing genius, because the metric divides current revenue by current spend while the recurring base which requires no spend compounds underneath it. Recurring revenue grew 28% sequentially in Q1; hold anything like that pace and recurring alone approaches $70M+ for the year, meaning each successive quarter’s revenue leans less on bought traffic and the ratio climbs by construction. That’s presumably what management means by reiterating that performance is “tracking in line with internal plans” while declining quarterly EBITDA guidance. The bear’s rebuttal is equally simple as the recurring line just missed its first quarterly checkpoint by 5%, and that’s the very line the arguments depends on.
The Verdict is that the guidance is intact but no longer comfortable. Q1 demonstrated the engine can force the topline; it also spent the slack. From here, watch the recurring revenue line against ~$17M in Q2 and the ROAS print against ~3.2x, those two numbers will tell you by September whether the $113M/$4M year is happening, well before the income statement does. Management’s history of delivery (forecast $9.6M, delivered $9.5M; targeted $40M, delivered $43M) has earned some benefit of the doubt; Q1 spent a little of it.
Use Of Proceeds from the Raise
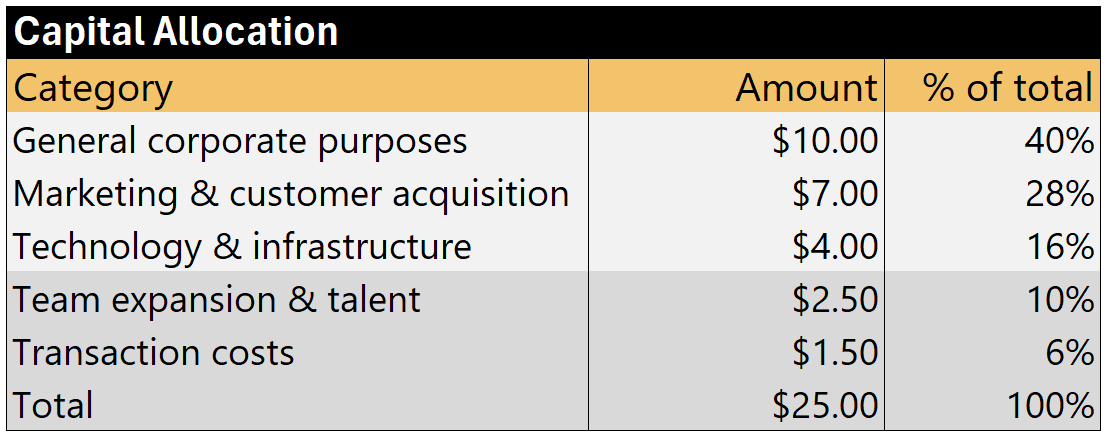
Notable is that the $7M marketing allocation is less than one quarter of current ad spend the raise wasn’t to fund growth (the 3-month-payback flywheel self-funds as discussed below), but to build the $27M cash cushion and pay for the listing. The 40% “general corporate purposes” bucket is the vague part watch where it actually goes.
Diagram 30: Capital Allocation of Money Raised
Competitive Positioning
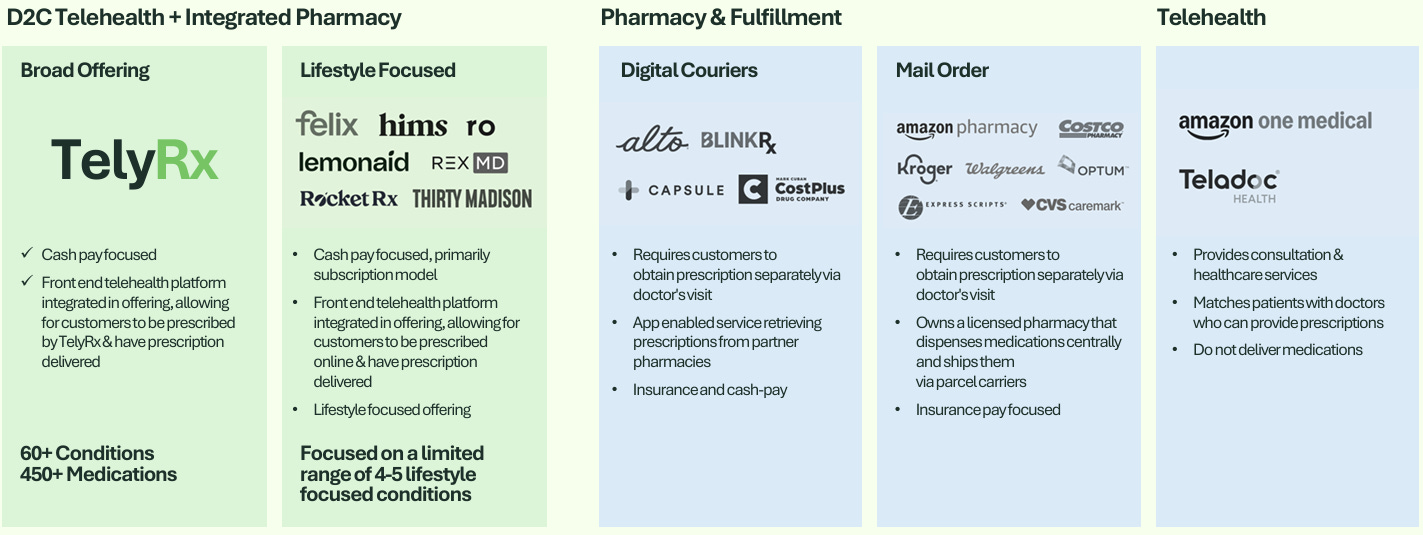
TelyRx’s structural claim is that it is the only player combining all three of: (1) full vertical integration that is prescribe → dispense → deliver in one flow; (2) a 100% cash-pay model; and (3) a broad everyday-medicine catalog (450+ drugs, 60+ conditions).
Diagram 31: Competitive Landscape
Lifestyle telehealth (Hims & Hers, Ro)
cash-pay and vertically integrated, but historically concentrated in 4–5 lifestyle categories. They went an inch wide and a mile deep; TelyRx went wide.
Digital couriers (Capsule, Alto, Amazon Pharmacy as fulfillment)
deliver, but you bring your own prescription.
Mail order (Amazon Pharmacy, CVS/Caremark)
dispense centrally and ship, but are built around insurance billing.
Pure telehealth (Teladoc et al.)
prescribe, then send you back into the pharmacy line.
The linchpin of the “moat” is legal, because the giants bill insurance and therefore touch Medicare/Medicaid dollars under the Stark Law (physician self-referral, 42 U.S.C. § 1395nn) and the Anti-Kickback Statute make integrating physician prescribing with owned pharmacy fulfillment a compliance minefield. TelyRx touches zero government-reimbursed dollars, so this body of law “simply doesn’t apply”.
I have four problems with treating this as a durable moat:
It is TelyRx’s own legal interpretation, and their own filings hedge it
The risk factors state the business model “may be subject to legal challenges and regulatory actions” and more pointedly that the patient-directed medication request model “may subject us to regulatory enforcement,” alongside acknowledged risks around abbreviated clinical assessments and corporate-practice-of-medicine rules. The very thing that makes the funnel convert (patient picks the drug first, provider reviews after) is the thing a state medical board or the FTC could decide looks like prescribing-on-demand. The moat and the biggest regulatory risk are the same feature.
The wall blocks insurance giants, not cash-pay entrants
Hims & Hers is cash-pay, vertically integrated, generates billions in revenue, and is expanding aggressively beyond its original niches such as hormonal health, menopause, low testosterone, labs and diagnostics, with stated ambitions of $6.5B revenue by 2030. Nothing in the Stark Law stops Hims from adding 400 everyday generics to its formulary tomorrow. Ro could do the same. The claim that broadening “is becoming an entirely different company” is a business-culture argument.
Amazon already owns both ends
Amazon owns One Medical (providers) and Amazon Pharmacy (dispensing), and runs RxPass a $5/month unlimited generic delivery for Prime members which is functionally a cash-pay generic pharmacy at scale. Mark Cuban’s Cost Plus Drugs is pure cash-pay, radically price-transparent, and frequently cheaper than TelyRx on the underlying drug; it doesn’t prescribe, but pairs with any telehealth visit. The cash-pay lane is not as empty as the deck implies and TelyRx’s edge is the integrated convenience bundle, not exclusivity.
Low capital intensity cuts both ways
Two leased pharmacies serving 97% of the U.S. population is a wonderful capex story and proof that the structure is replicable by any funded entrant with pharmacy licenses and a performance-marketing team. The honest version of the moat is a two-year head start, nine quarters of cohort data, an increasingly efficient acquisition engine, and brand trust are real advantages, but advantages of execution, not law.
There’s also the substitute problem as for insured patients, using coverage is often cheaper, and the $98B cash-pay segment remains a fraction of the $585B insured market. TelyRx is betting people will pay for time. The cohort data says many will; the question is how many.
One competitor class is missing from the deck’s landscape slide entirely a manufacturer direct-to-consumer(Manufacturer DTC only works for branded, patent-protected drugs, because it requires a manufacturer with a monopoly molecule), which TrumpRx is actively accelerating. LillyDirect already bundles telehealth prescribing and home delivery for Eli Lilly’s own drugs; Pfizer and peers are building the same. These players have an unbeatable cost advantage on their own molecules TelyRx sells Zepbound and Mounjaro at a markup Lilly doesn’t pay. The defenses are structural as no manufacturer will ever stock 450 drugs from its rivals, so breadth and the one-flow experience stay TelyRx’s, and the branded slice of the formulary is deliberately small (no drug >10% of revenue). But a government reference-price hub for 600+ generics also compresses the pricing umbrella under the ~70% category margins transparency was TelyRx’s weapon against PBM opacity, and it cuts back when the government does it at scale.
On the plus side of the ledger is that the formulary diversity (no drug >10% of revenue, no GLP-1 dependence, no compounding exposure, a real differentiator versus Hims’ compounded semaglutide regulatory adventures), the airport-adjacent logistics footprint that could itself become a competitive advantage at scale, and 14 contracted practice groups covering 48 states, which took two years to assemble and is harder to replicate than it sounds.
The Frictions to Getting Big and the Capital Cycle
The binding constraint is the price of attention. TelyRx grows by buying high-intent search and social traffic, essentially thats the pool of people googling “buy azithromycin online” which every month is finite, the cheapest keywords get exhausted first, and every incremental cohort costs more than the last. Scaling from $113M to $300M means graduating from harvesting existing intent to creating demand (brand, TV, organic content), thus slower and more expensive per dollar. The secondary frictions are pharmacist and licensed-staff hiring (pharmacist-in-charge rules per state), customer service for a base growing ~45% a quarter, and the awareness ceiling of cash-pay itself as most of the $98B market doesn’t yet know the category exists, and educating it is what the marketing budget is buying.
What is not a constraint is the physical capacity and the annual statements show it as Gross property and equipment at the end of 2025, covering both pharmacies and their combined 250,000 scripts/month capacity: $823 thousand ($517k leasehold improvements + $306k equipment). The Dallas node is half the network, cost roughly $500–700k; the buildings are leased (~$0.8M/year of rent). A hypothetical facility #3 is ~$2M all-in including inventory and licensing; doubling total network capacity is perhaps $3-4M, and probably less, since a second shift and some automation inside the existing footprint is the cheapest capacity of all. The existing two buildings support ~$330M of annual revenue (250k scripts × ~$110 AOV) which is roughly 3x the 2026 outlook, before a single growth dollar goes into capex. In the last quarterly results they filled 236k prescriptions while achieving 19.4 million usd in revenues.
The company’s capital cycle is a 90-day flywheel. Cash → marketing → customer at ~$113 CAC → payback in ~3 months → recurring gross profit at 55–65% → back into marketing. Because CAC is expensed rather than capitalized, the P&L looks like losses while the balance sheet barely moves; customers pay by card before the box ships (AR: 3 days), inventory turns in ~13 days against ~40 days of payables, so growth consumes essentially no working capital. The machine recycles its own fuel quarterly which is why the only financing event in the company’s history was for marketing fuel and listing costs, not plant, and why outside capital is only needed for deliberate acceleration.
What Actually Protects This Business
Since the marketed moat is the weakest one, here are the possible factors that defend TelyRx today versus what it could become at scale.
Real today, modest.
The license stack: pharmacy licenses across ~48 jurisdictions plus 14 practice groups on the provider side it is replicable, but only at state-board speed; an 18–24 month head start that renews itself as long as TelyRx keeps compounding while a copycat is still filing paperwork.
The auction economics of breadth: the most underrated one, and the real answer to “why hasn’t Hims done this” is customer acquisition happens in keyword auctions, and the bidder who monetizes a click best eventually owns the keyword. A narrow lifestyle player bidding on “azithromycin online” monetizes one product; TelyRx monetizes the whole 450-SKU basket behind the click ($524 lifetime revenue and climbing, +15% basket per repeat). Higher LTV per click means sustainably outbidding anyone narrower on the same traffic, breadth is not a catalog claim, it is a structural CAC advantage that compounds as cohorts mature.
Cohort dataset: nine quarters of keyword-level CAC, conversion and retention data across 60+ conditions, now run in-house the same unglamorous asset that is Hims’ actual moat. A funded entrant starts that learning curve at zero while paying today’s ad prices.
Real at scale, not yet there.
Default-ness: medication is autopilot behavior once refills arrive reliably, nobody churns to save $4, and pharmacy is a trust-sensitive category where accumulated legitimacy is slow to build and slow to erode. The 98%-repeat-within-90-days figure is early evidence; this becomes the dominant moat at a million customers and is embryonic at 200k.
Purchasing scale: gross margin went 37% → 55% largely via direct-from-manufacturer buying, with ~70% margins cited on much of the formulary at scale, generic procurement costs undercut any subscale copycat’s price floor. '
Logistics density: 24-hour national shipping from two airport-adjacent nodes today; same-day in major metros would make speed itself the product (an antibiotic needed today is a different product than one arriving Thursday) neither couriers (can’t prescribe) nor telehealth (can’t dispense) can match it alone. Optionality, not yet a moat.
The honest version of the Stark argument is not legal prohibition but counter-positioning as CVS, Walgreens and Amazon could build this, but transparent cash pricing sitting next to their own PBM(Pharmacy Benefit Manager,the middleman that runs prescription drug coverage for insurers and employers) spreads is self-immolation, incumbents don’t attack models that embarrass their core economics until forced. A real moat, just a behavioral one, with the legal layer adding friction rather than constituting the wall. TrumpRx strengthens this moat from an unexpected angle as federal policy is now actively squeezing the PBM model and celebrating cash transparency, which makes the incumbents’ dilemma worse as the longer they defend the spread economics Washington is attacking, the less able they are to chase the cash-pay lane TelyRx occupies.
What is not a moat is the tech platform (commodity webstack), the two warehouses themselves(for now), and the “only player with all three pieces” snapshot is a description of today, thus it is not a defense for tomorrow. TelyRx today is protected by execution moats (head start, acquisition data, breadth economics), while the durable ones (default-ness, purchasing scale, density) all arrive as functions of staying biggest in the niche. That makes the next eight quarters not just a valuation story but the moat-construction window itself in this category, scale isn’t protected by the moat; scale is the moat.
Green Flags
Execution against forecasts
guided $9.6M year one, delivered $9.5M; targeted $40M year two, delivered $43M.
Clean cash-pay balance sheet
$736k of AR on a ~$80M run-rate, $27M cash, modest fixed-rate bank debt. No insurance, no PBMs, no inventory risk of note.
Variable cost base
marketing is the P&L; it can be dialed down to defend liquidity at any time, which is why FCF burn is near zero despite hypergrowth.
Cohort consistency
nine cohorts, one curve. $524 LTR on the oldest cohort and still compounding; three-month payback.
No-warrant financing
US$25.8M raised at C$4.5 with no warrant sweetener, rare quality signal for a Canadian microcap.
Genuine capital discipline
one equity raise in four years, major shareholders funded growth with their own 12% loans rather than dilution, ~116k total options/warrants outstanding, insider debt repaid the moment bank financing was available. The cap table behavior of owners, not promoters.
Upgraded management
a CEO who ran a $2B P&L, a TPG partner and a Harvard MD-MBA on the board of a $90M company. All directors with clean ten-year records, no cease trade orders, bankruptcies or sanctions.
Red Flags
The moat is a legal opinion
The same patient-directed model that drives conversion is flagged in their own risk factors as a regulatory enforcement risk. This is the single biggest risk to the thesis.
Share overhang is imminent
~8M PP shares free around August 1, 2026; next escrow tranche roughly a month later; Hyperion’s 3.8M advisor shares of uncertain escrow status on top. Expect supply.
Promote stock in the float
an investment bank and “joint actors” control 14.4% of the liquid share class, acquired through the transaction with no disclosed consideration near-zero cost.
Governance
rolling 10% evergreen equity plan, US$195k director retainers, front-loaded CEO RSU vesting, and a Cayman-flavored register. One nuance in fairness is that the dual-class structure is not the usual founder-supremacy wedge as each PVS carries 100 votes but converts into 100 SVS, so voting power tracks economics almost exactly; the PVS exist mainly for U.S. securities and tax structuring, with the real cost being SVS liquidity. In addition,the structure is essentially hired managers, while sitting in a boat with these big shareholders that have been providing loans and funding the company.
Marketing efficiency is declining
ROAS has fallen from ~5.8x to 2.4x; management guides to rising blended CAC. The deck’s headline “3.0x” is an inception-to-date average which is mildly misleading presentation.
Management’s exit claims are embellished
real transactions, inflated attribution (the CEO left Digicel three-plus years before the Telstra sale, however she stayed as director; the CFO’s “$1.2B in exits” is unverifiable, and his OnwardMobility chapter goes unmentioned). A permanent discount on taking the deck at face value.
Regulatory risk, properly sized
the patient-directed model is the genuine open question as the “refill you already know you need” framing is marketing; legally every first order is a new prescription written off an async questionnaire by a provider who can’t verify any prior script. The risk is graduated, not binary as prescribing oversight is state-by-state (a hostile board costs one state they already skip NC and Arkansas; even California is only ~12% of the map), the exposure concentrates in the first transaction while recurring orders (⅔ of revenue and growing) refill prescriptions written inside their own system, and TelyRx deliberately opted out of every category that actually destroyed telehealth peers such as no controlled substances (Cerebral, Done), no compounding (the GLP-1 crackdowns), no insurance billing (fraud statutes, audits, clawbacks).
Not yet profitable
adjusted EBITDA negative in 2024, 2025 and Q1 2026. The path to the $4M full-year figure requires both the revenue ramp and operating leverage to show up simultaneously.
Competitive convergence
nothing legally prevents Hims, Ro, or a new entrant from going broad-formulary cash-pay. The head start is the moat.
Risk / Reward Matrix
Probabilities are my subjective estimates over the stated window; potential impact is on the share price, not the business per se. Starting out with the risks:
Diagram 32: Risks
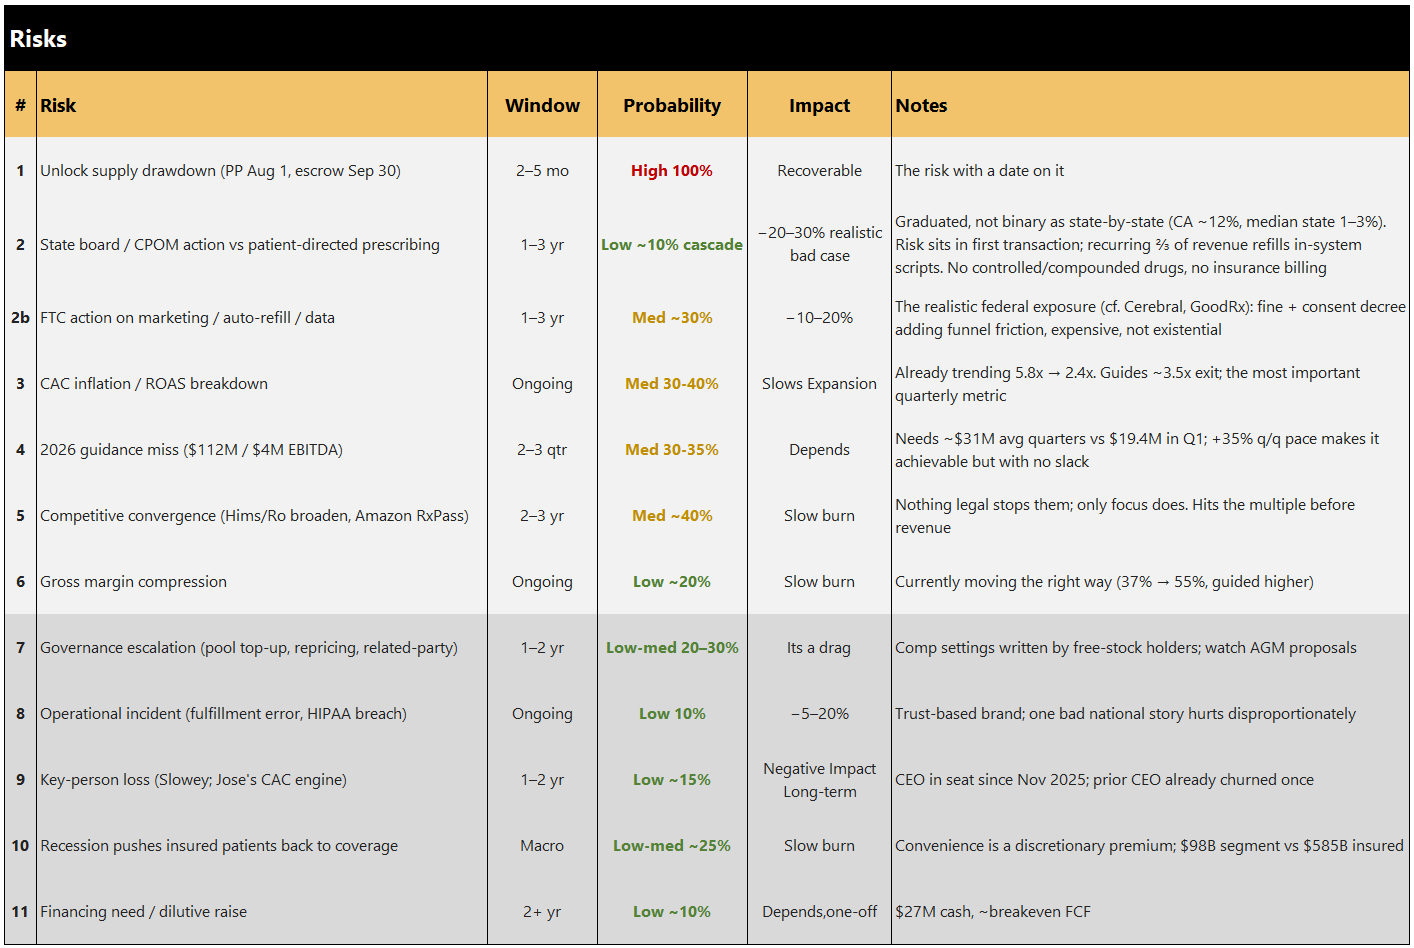
Note: for row 2b (FTC action) the Probability arguably lower post-TrumpRx, a federal government actively promoting cash-pay medicine is unlikely to prosecute the model itself; the marketing-practices exposure remains.
Rewards:
Diagram 33: Rewards
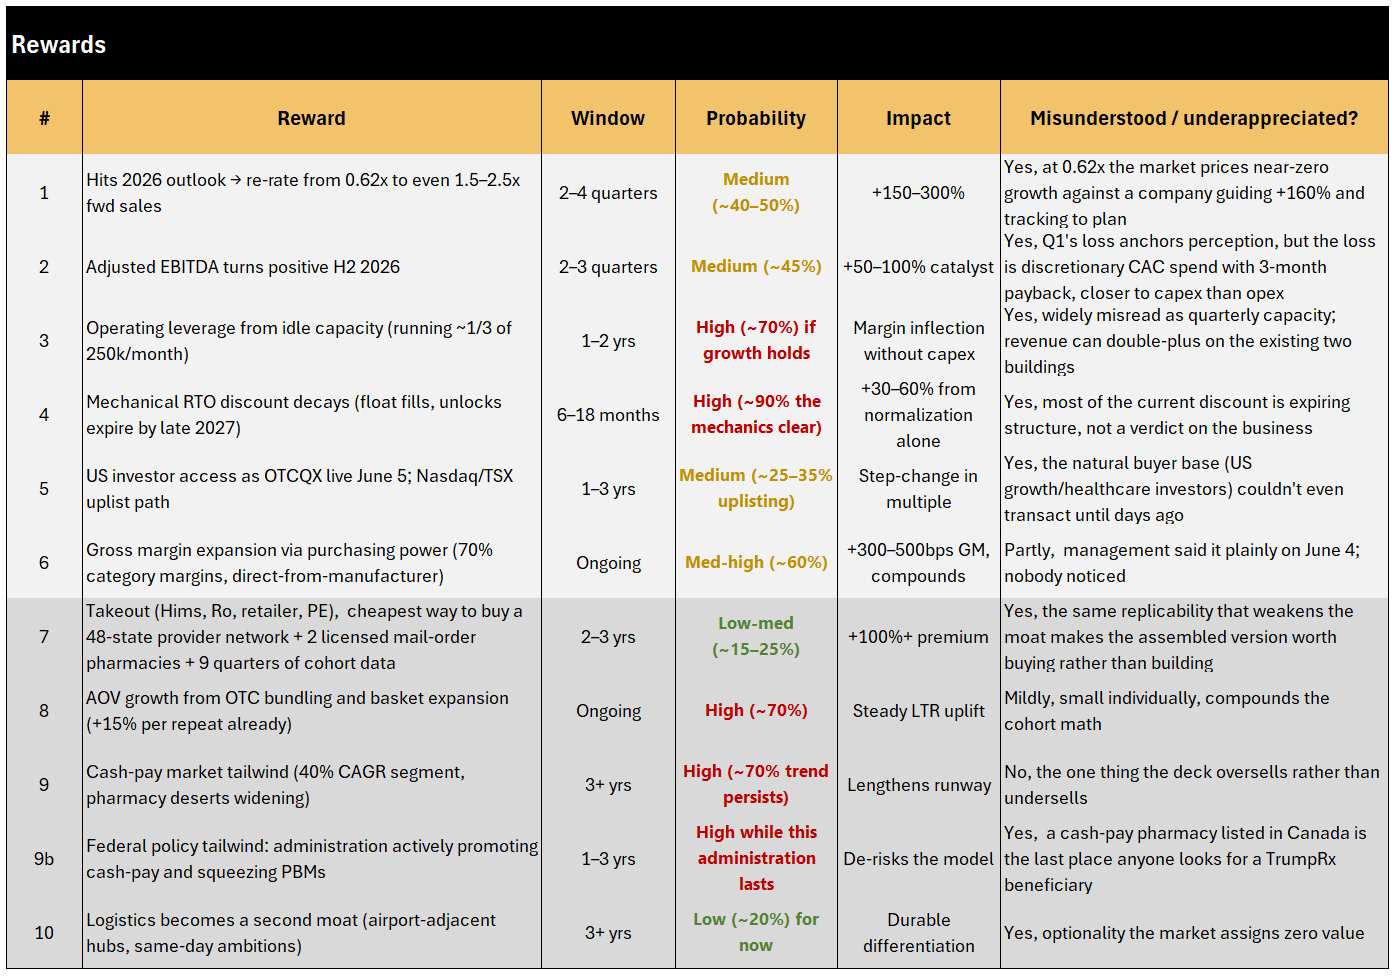
Some of the rewards based in my opinion also converge, such as the RTO discount and hitting outlook leading to a re-rate. The shape that falls out of this is that the high-probability risks are short-term and recoverable, the severe risk is low-probability and graduated state-by-state. Valuation is also on the lower-end as is seen below, therefore reducing risk.
Valuation
At ~C$2.45 (≈US$1.75) on 48.85M implied shares we have a market cap of ~US$86M, less $27M cash plus $10.2M debt = EV ≈ US$69.2M.
One note about the EV is that its insensitive to how one treats the $10.2M cash collateral, netting it against the loan or excluding both yields approximately the same EV.
I would argue EV/EBITDA is the wrong lens entirely for a company deliberately running at breakeven to buy three-month-payback customers on the outlook’s $4M it is a meaningless ~17x.
The relevant frame is:
EV/2025 sales: ~1.6x
EV/2026E sales: ~0.61x
For a 100%+ grower with 55% gross margins, three-month CAC payback and two-thirds recurring revenue, sub-0.7x forward sales is the kind of multiple normally reserved for declining retailers. The comp set makes the dislocation explicit (peer EVs approximate, as of June 12th 2026 1 USD = 1.4 CAD):
Diagram 34: Comparable Company Analysis (Values in USD unless stated otherwise)
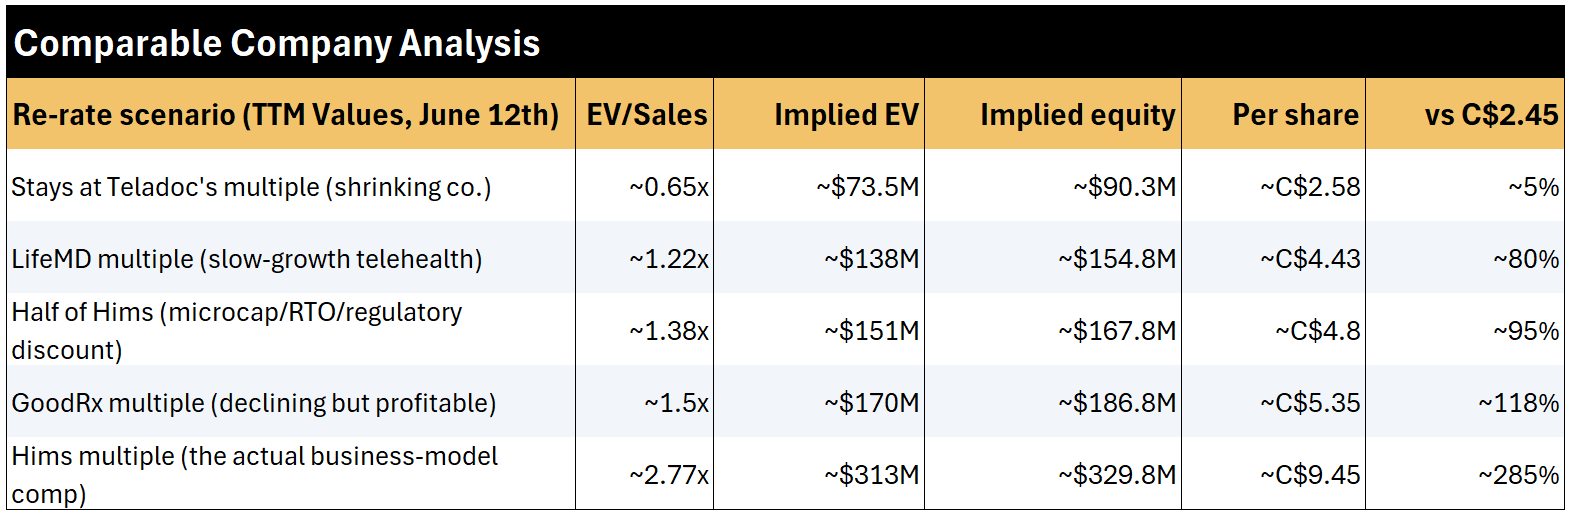
The anomaly in one sentence is TelyRx as they are the fastest grower in the set by a factor of six and trades around the same EV/Sales as Teladoc, whose revenue is shrinking, and at half of LifeMD, which grows at a sixth of its rate.
The standard rebuttals are all true lowest gross margin in the set, thinnest EBITDA, smallest float, RTO baggage, regulatory tail, but they argue for a discount(especially as the cited companies are larger), not for pricing a +161% grower like a melting ice cube. The caveats is that TELY’s 0.62x rests on management’s outlook rather than trailing reality (2025 EV/Sales is 1.6x still the cheapest in the set growth-adjusted), and a Q2 disappointment inflates the forward multiple instantly. If management hits the $113M outlook and EBITDA crosses zero, the re-rate does the heavy lifting; if growth merely halves to ~$85M, you still own it at less than 1x sales.
The bear case writes itself too a state regulator or FTC action against patient-directed prescribing, a CAC blowout that breaks the cohort math, or Hims waking up one morning and listing 400 generics.
Having a look below to get to construct an approximate projected FY2026 income statement anchored to TelyRx’s own disclosed figures. Q1 2026 actuals ($19.4M revenue, $10.7M gross profit) form the base, with Q2–Q4 extrapolated using the company’s implied revenue trajectory and cost structure from its most recent MD&A. Revenue reaches $113.6M for the full year, consistent with sustained triple-digit growth(as well as projections), while gross margin holds steady at approximately 56%, reflecting the company’s blended product and service mix. The advertising and marketing line declines as a percentage of revenue through the year (from 42% in Q1 to 28% in Q4), reflecting the operating leverage that management has guided toward as the subscriber base matures. The Q1 listing expense of $2.3M is treated as a one-time item and excluded from the run-rate cost base.
Diagram 35: Income Statement Approximation Based on Guidance(Values in USD unless stated otherwise)
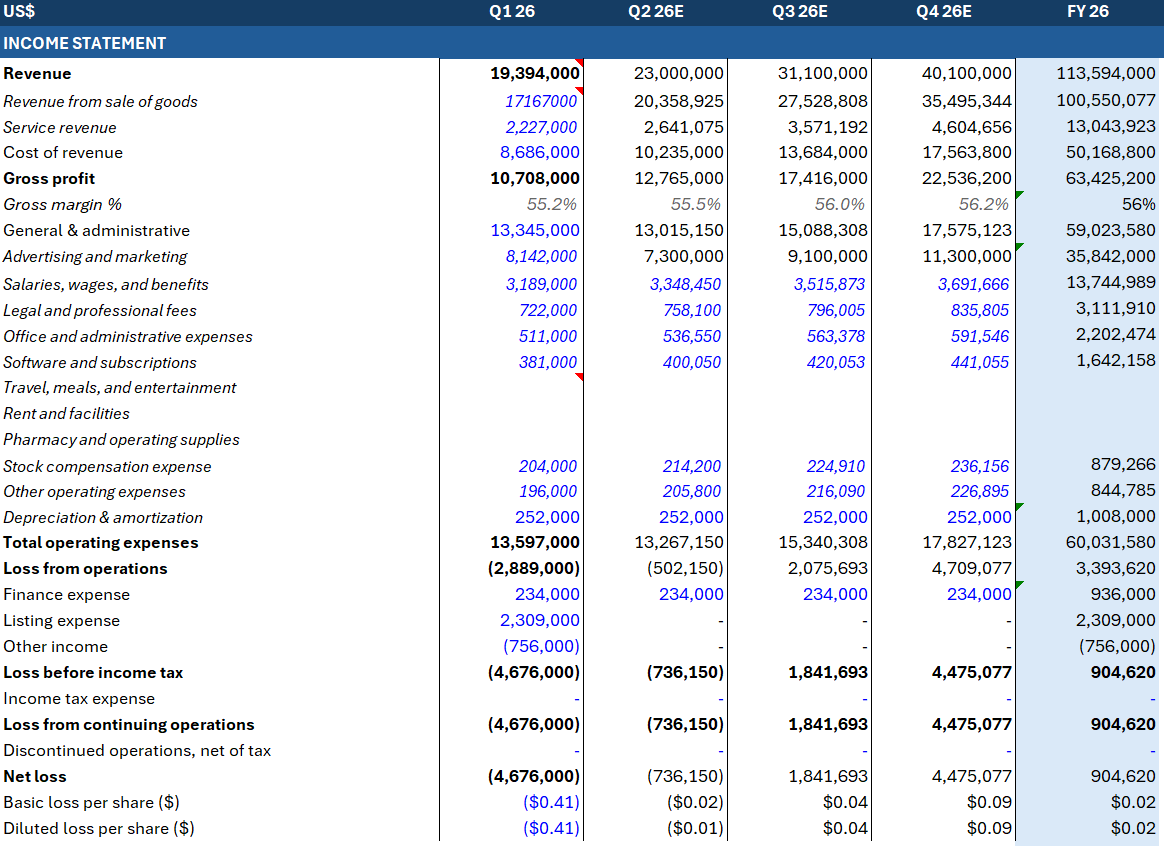
On this trajectory, TelyRx exits the year generating positive operating income and lands at approximately $904k in net income for FY2026 thin, but a meaningful inflection from the losses of prior periods. The key variable that determines whether this scenario holds is the marketing line, if customer acquisition costs prove stickier than assumed, or if the growth rate requires heavier spend to sustain, the profitability inflection shifts into 2027. This is without taxes, as we there should be around 6M-8M in tax pools to take advantage of.
Sensitivity Analysis
To stress-tests Q4 2026 diluted EPS across two variables I use revenue deviation from the base estimate (rows, -7.5% to +7.5%) and marketing spend as a percentage of revenue (columns, 20% to 50%). The base case highlighted in gold at 35% marketing and 0% revenue deviation produces $0.034 diluted EPS. The 35% marketing assumption is loosely benchmarked against Hims & Hers, which ran at 36% of revenue in for Q1, though that comparison carries an important caveat as Hims is still in partially in growth mode, so a portion of its marketing line is growth investment rather than maintenance. This is all done in part to get an Idea of the potential underlying profitability.
Diagram 36: Sensitivity Analysis based on Revenue Deviation for Q4 Top-line Estimate vs Marketing Spent Percentage as of Revenues. Showing impact on Diluted EPS (Values in USD unless stated otherwise, after-taxes of 25%)
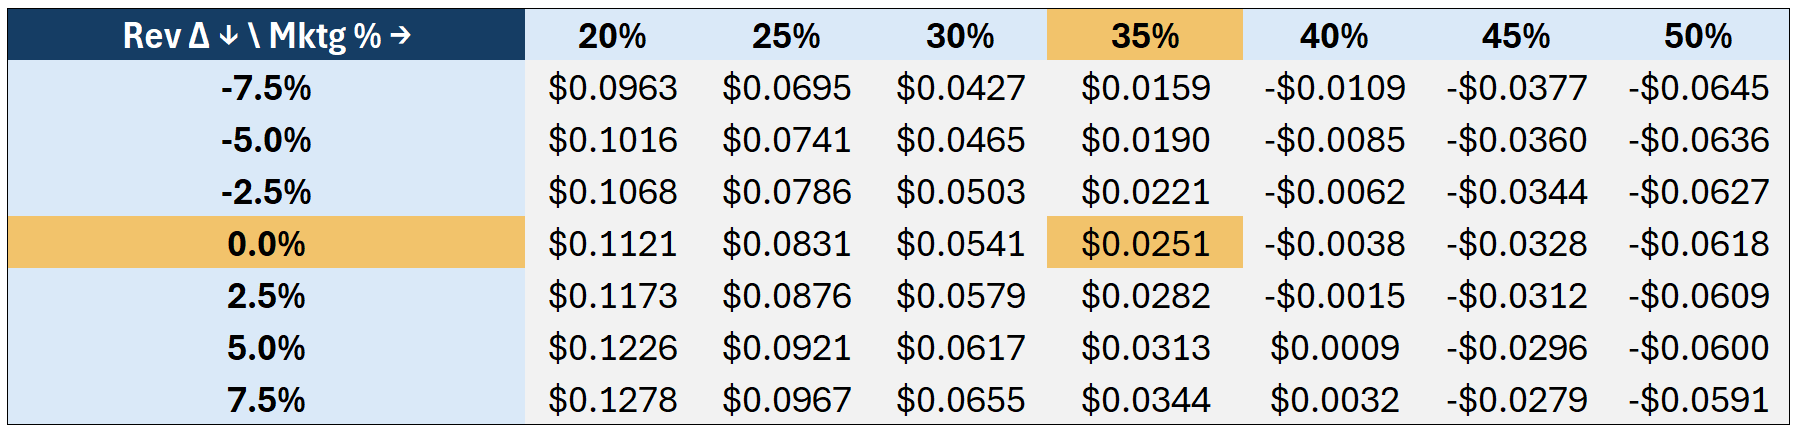
TelyRx’s own implied guidance trajectory has marketing declining toward 28–31% of revenue by Q4 2026, which would place the company to the left of the base column. The table illustrates how sensitive earnings are to this one line item moving from 35% to 25% marketing at flat revenue adds approximately $0.077 to diluted EPS, while moving from 35% to 45% wipes out $0.078.
Looking below the sensitivity analysis runs the same and presents the output as absolute net income. At the base case (35% marketing, 0% revenue deviation), the company generates $1.31M in after-tax net income for Q4 2026.
Diagram 37: Sensitivity Analysis based on Revenue Deviation for Q4 Top-line Estimate vs Marketing Spent Percentage as of Revenues. Showing impact on Net Income with Hypothetical Tax Charge of 25% (Values in USD unless stated otherwise)
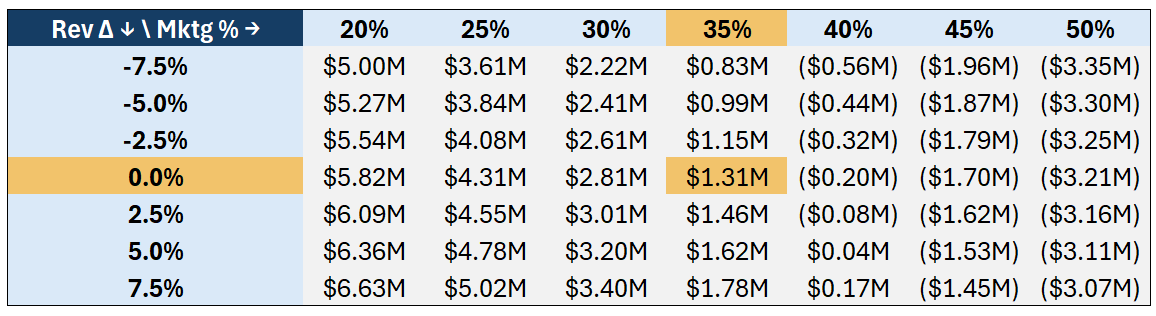
The range of outcomes across the full matrix spans from $6.63M profit (20% marketing, +7.5% revenue beat) to a $3.35M loss (50% marketing, -7.5% revenue miss) a $10M spread driven almost entirely by assumptions about one line item. TelyRx has not guided to a specific effective tax rate and currently carries loss carryforwards that may shelter near-term income. Investors should treat the Diagram 34 figures as a directional scenario rather than a precise forecast.
Applying potential PE ratios at using the same Q4, but included with taxation, we land at a potential ratio of 5.3x to 17.4x without pricing any potential marginal increase in revenues after that point, and utilizing a fully diluted share count.
Diagram 38: Sensitivity Analysis based on Revenue Deviation for Q4 Top-line Estimate vs Marketing Spent Percentage as of Revenues. Showing impact on PE with a Hypothetical Tax Charge of 25% (Values in USD unless stated otherwise, based on a share price of C$2.45)
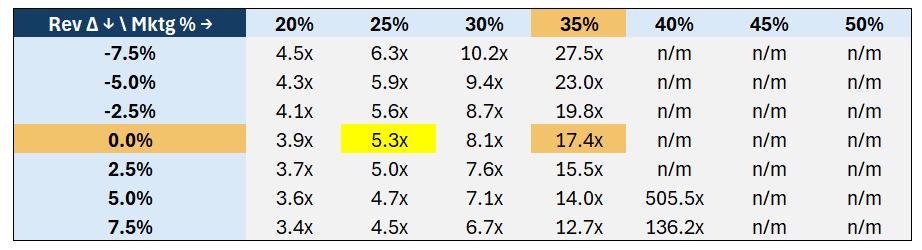
This is just to provide an idea of the potential valuation that we could find ourselves in within the next few months with the growth rate, of course this all rests on reaching the Q4 numbers which I am sure that they will achieve. Overall, I’d say based on the current growth rate, we are more than likely to be in an attractive price range with the potential to go lower despite strong growth tailwinds.
Marketing Spend as a Share of Revenue
Using the revenue-weighted average marketing spend ratio across FY24, FY25, and projected FY26, a normalized marketing spend level of approximately 32% of revenue can be derived. Assuming this ratio and annualizing Q4 FY26E results, the company would trade at approximately 10.3x forward earnings based on a share price of C$2.45 and 51 million fully diluted shares(C$127M Marketcap) .
Using the revenue-weighted average marketing spend ratio across FY24, FY25, and projected FY26, we arrive at a normalized marketing spend level of approximately 32% of revenue.
Diagram 39: Quarterly and Fiscal-Year Marketing Expenditure as a Percentage of Revenue (FY2024–FY2026E)
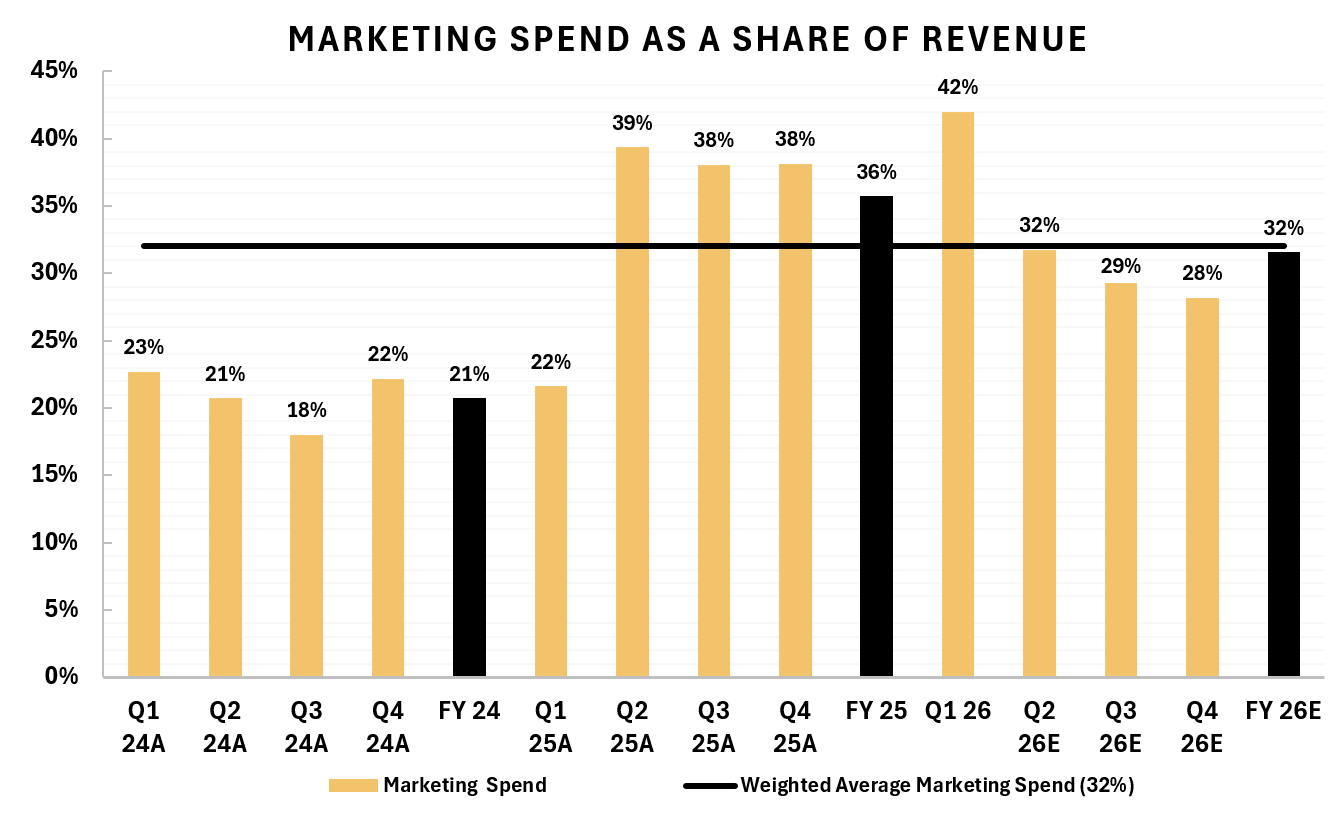
Management has indicated that marketing efficiency is expected to continue improving. If marketing spend declines to the projected 28% of revenue level while maintaining current revenue performance, the implied forward P/E would decrease to approximately 6.7x.
A further reduction in marketing intensity may also be achievable over time. In FY24, the company operated with marketing expenditure of approximately 18–22% of revenue while continuing to grow the business at low double digits or just steady revenues. As the customer base expands and recurring revenue becomes a larger component of total revenue, a growing share of revenue will be generated from existing customers rather than newly acquired customers. Consequently, the company may require proportionally less customer acquisition spending to sustain revenue levels, allowing a larger share of revenue to convert into earnings.
Under a maintenance scenario in which marketing spend gradually reverts toward historical FY24 levels of 18–22% of revenue, while revenue remains broadly stable, the implied forward P/E would fall to approximately 3.5x–4.4x based on annualized Q4 FY26E performance. While this scenario is illustrative rather than a forecast, it highlights the substantial operating leverage embedded within the business model.
Using Q1 annualized results as a steady-state earnings base, the company would trade at approximately 19.8x-40.2x pe, assuming marketing spend declines to 18–22% of revenue. While it may be possible for marketing intensity to fall even further as the recurring revenue base expands and customer acquisition becomes a smaller component of overall revenue generation, the 18–22% range is based on the company’s historical operating profile and is therefore a more conservative and defensible assumption. Below we can see how the revenue share by customer type develops.
Diagram 40: Quarterly Revenue Share By Customer Type (FY2024–FY2026E)
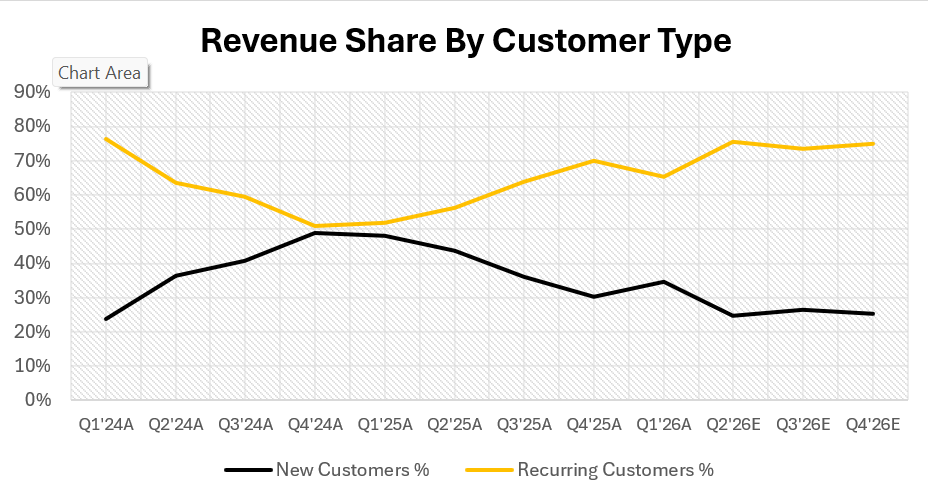
As such, this range may provide a reasonable indication of the company’s long-term earnings potential using current available numbers and assuming no to negligable growth. They have the cash to easily grow into their guidance, so I don’t see much value using Q1. It was more so for illustration for those wondering how it would currently look like, but its totally neglecting the growth rate. Just to given an idea how costs would look like in a break-even scenario in terms of Marketing as its the main Variable cost; following the aggressive customer acquisition investments made throughout FY25 and FY26E, the break-even marketing threshold increased materially, reaching approximately 55% of revenue in FY26E.
Diagram 41: Quarterly as well as Fiscal Year Marketing Spend of SG&A assuming Break-even Scenario (FY2024–FY2026E, 0% indicate unprofitability despite no Marketing Spend, Golden line is a 4 Quarter Moving Average)
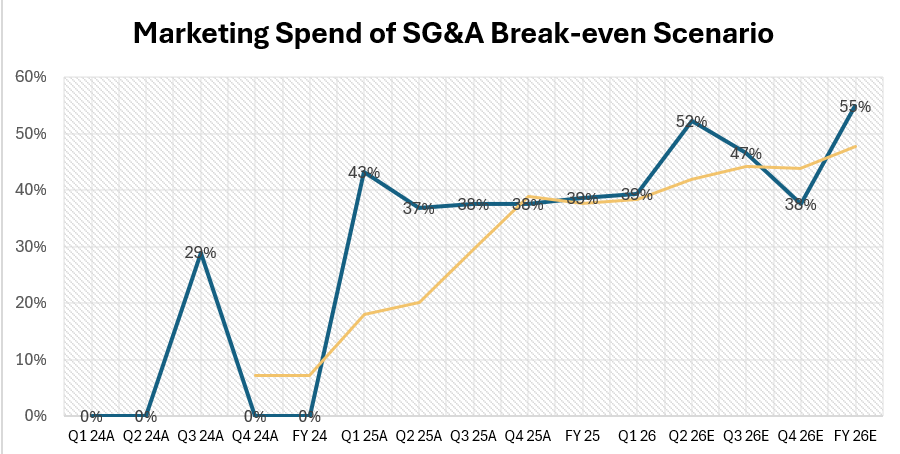
This suggests that the company has built a significant profitability buffer, as current marketing intensity remains well below the level required to eliminate earnings entirely. Consequently, future improvements in marketing efficiency or reductions in customer acquisition spending could have a disproportionate impact on earnings generation.
Overall, the analysis demonstrates that relatively modest improvements in marketing efficiency and reductions in marketing spend as a percentage of revenue can have a disproportionate impact on earnings. At the current share price, this creates significant potential for multiple compression as the business matures and recurring revenue represents an increasing share of total sales, one can also apply discounts for safety as it uses Q4 estimates. This is just to show the underlying model, and its profitability.
This is all without projecting major growth into the future after 2026, so there is so much optionality around valuation if you strap the underlying growth spend. Currently, it doesn’t make much sense to do a DCF calculation as it will only proof a strong discount without much of an insurance in regards to the growth, however we do know their growth pathways are very long and much without capex needs. Depending on your view, Tely is either slightly overvalued to very undervalued based on pe without growth spent. In my book, its the latter.
Conclusion & Strategy
TelyRx is a speculative growth stock, not a value compounder, with audited 180% growth(outlook of nearly 163% growth), real unit economics, a near-pristine balance sheet, and a management team that has so far done exactly what it said it would, priced at 0.6x forward sales because it listed through a CPC into a wall of future share supply. I like it overall, quite a bit, it has real fire as a growth story with a sexy narrative, and judging by today’s multiples it is arguably not being fairly valued against its own outlook presenting a good risk/reward at current prices.
Rating: B-. Strong growth, interesting positioning, a seemingly capable team(I am not completely sure on insider alignment with shareholders just yet), balanced with a moat that rests on a legal interpretation, a heavy unlock calendar, and governance that needs to grow up alongside the company. Position sizing matters more here than usual, as previously stated its undervalued based on growth and stripping out potential growth spend in a conservative way. However, it is not yet profitable.
What could increase the rating is of course over time continuing to hit guidance to establish confidence in the ability to execute(especially on the ROAS part). In addition I’d like to see the concern for more dilution through evergreening to subside via managements actions of taking less than they could or change that(however, keep in mind major shareholders would be very opposed as they are not part of management and own way over 50% of the subordinate voting shares, while management only has RSUs). Furthermore, as the thesis gets proven the thesis changes either up or down. Currently, it is pretty attractive based on estimates.
Thank you for reading my article!
See you soon,
Lukas, Pixel Research
Disclaimer
This is not financial advice as Pixel Research content is not meant to be a substitute for financial advice. Since we don’t offer financial advice, the material provided shouldn’t be interpreted as tailored investment advice. It is crucial to carry out in-depth research and, if required, speak with a licensed financial expert before making any financial decisions.
Works Cited
[TELY Investor Deck, June 2026 (company)]
[TelyRx Q1 2026 Interim MD&A and Financial Statements, May 12, 2026 (SEDAR)]
[TelyRx Management Information Circular, May 25, 2026 (SEDAR)]
[TelyRx Q1 2026 earnings call transcript, May 13, 2026; Small Cap Growth Virtual Investor Conference transcript, June 4, 2026]
[Apolo V Acquisition Corp. Final Prospectus]
TelyRx Investor Presentation June
TelyRx Investor Presentation IPO
Digicel agrees to sell its 75% holding in Myanmar Tower Company to edotco
Hyperion Capital early warning release, May 8, 2026 (full text)
Export Finance Australia financing of Telstra’s Digicel Pacific acquisition
Irish Times: O’Brien cedes control of Digicel in $1.8bn debt restructuring