

Why Gold Still Wins
Robust fundamentals remain the anchor as market turbulence creates a rocky path ahead.

Gold is looking pretty rough the past few days after an excellent rally that was historical in some ways. Silver of course followed suit, matter of fact the whole metals market did. Truly a sight to behold.
So going into this, I am not the typical kind of person that is like “look at the global debt, look at this. The WORLD IS FALLING APART!!! UGH.” I am a tad bit different, I like to be rational and for that let as take a look at the fundemental case for gold and in particular what to look out for. Lastly forming a strategy based on that.
Just to set the stage the gold drawdown was definitely one to remember, just reversing around the 4670 USD area which is an important one of note. Looking below at the first diagram it makes clear what has really happened on friday.
Diagram 1: Last 5 Trading Days showing a Classic Parablic Breakdown
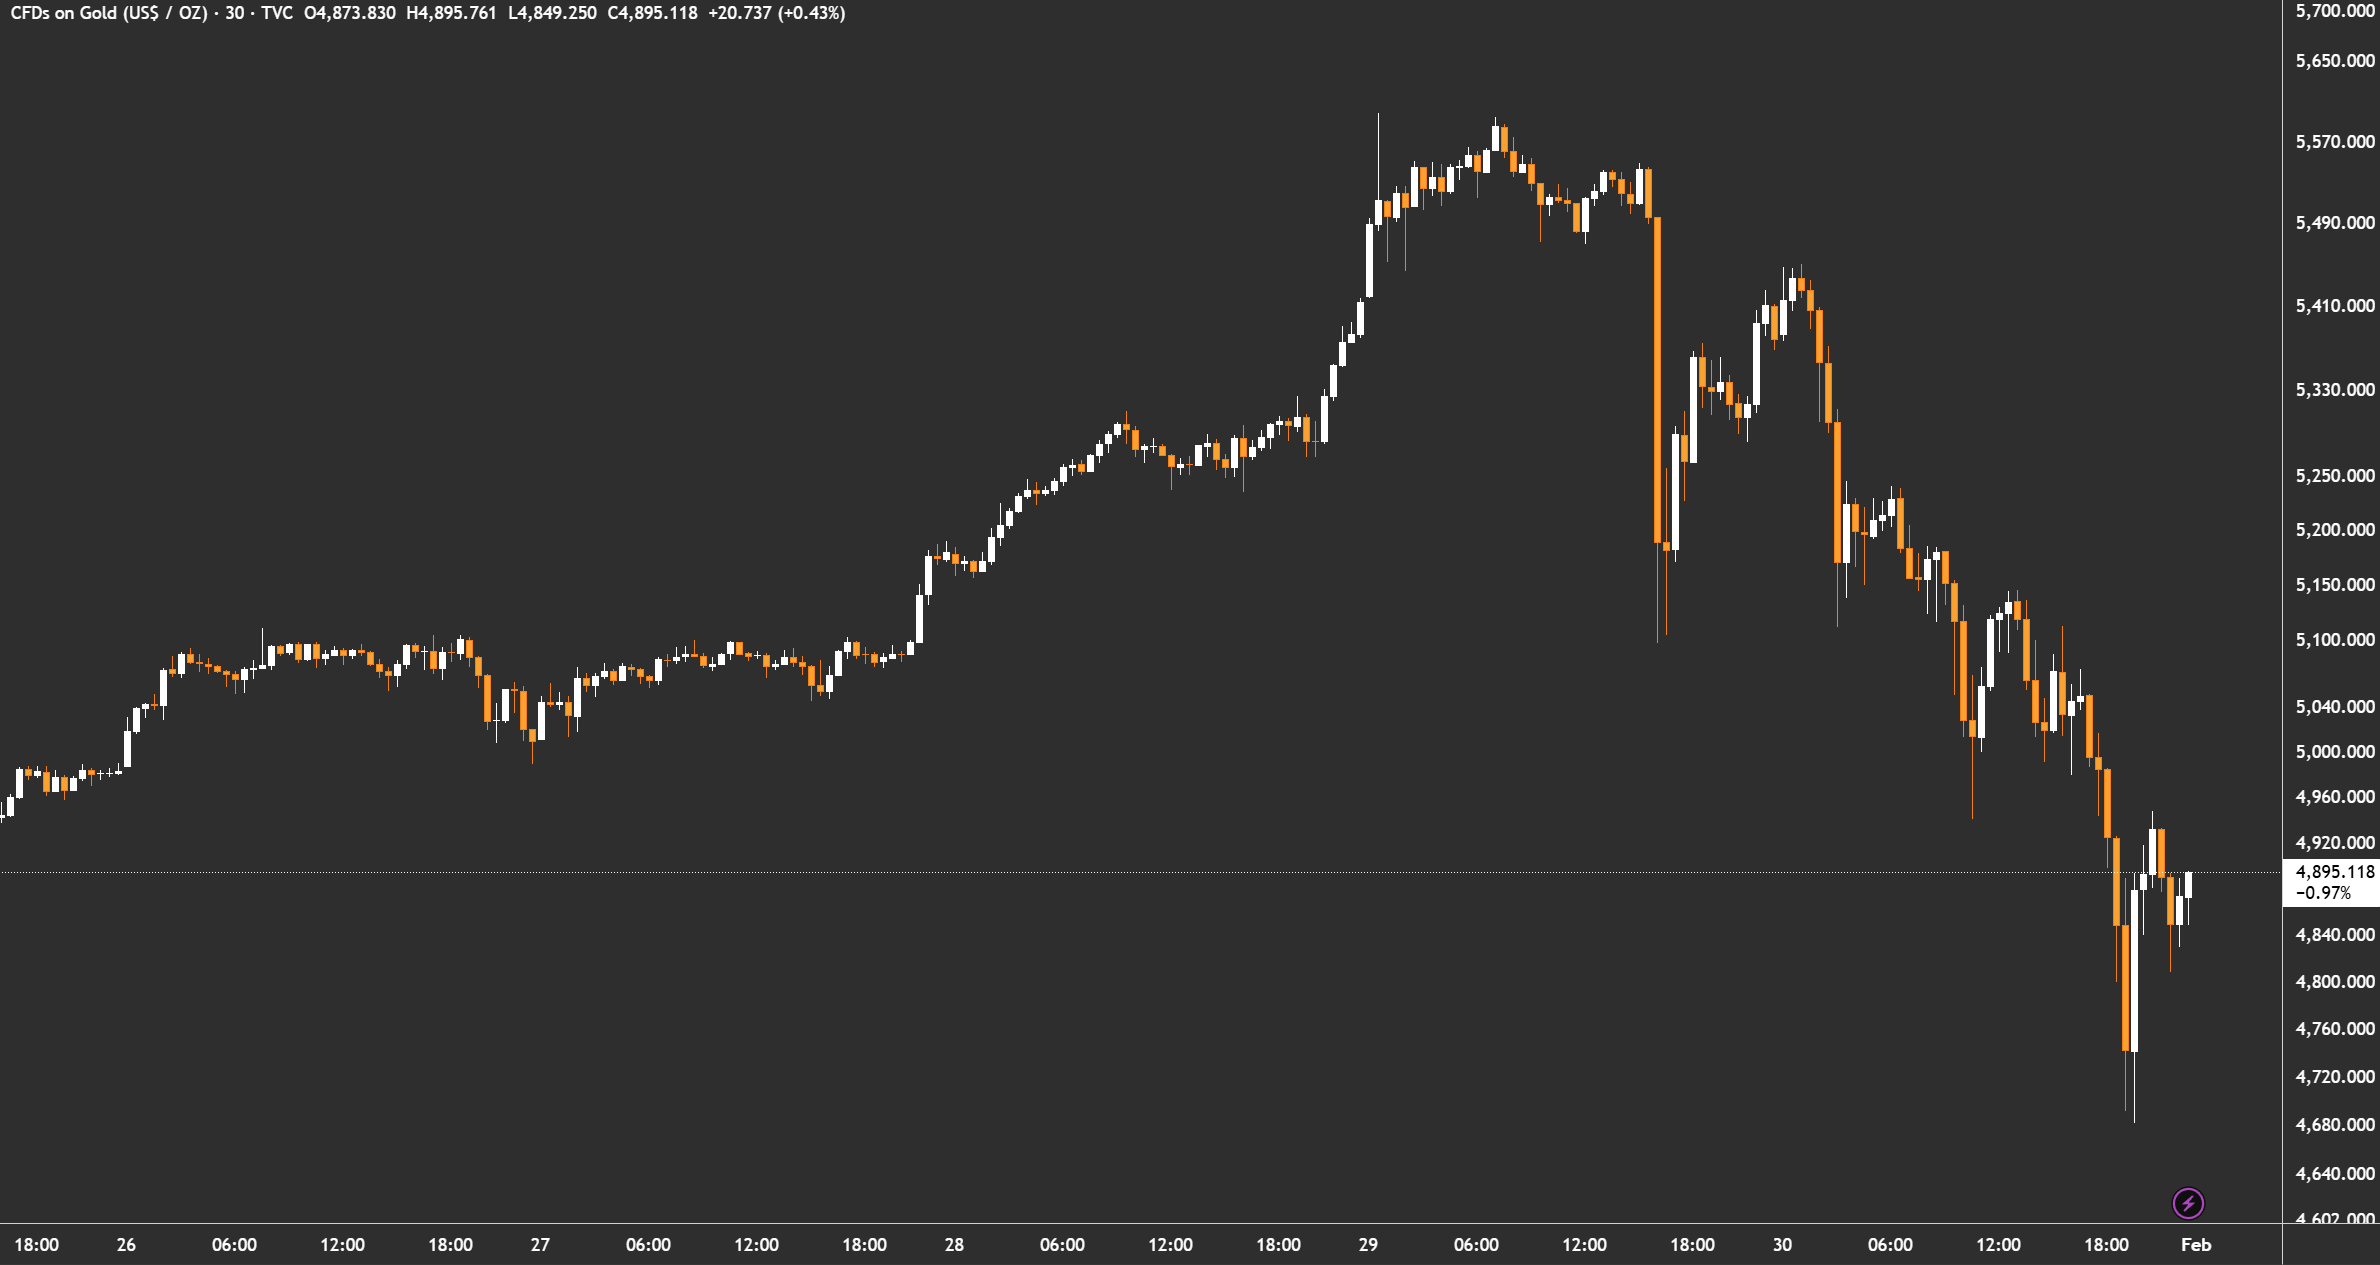
What we can take of note is of course as always three key things that unraveled in this whole move
Flash crash, likely caused by the typical leveraged system and stop-losses by several institutions. Maybe somebody even fat-fingered. However, this tells us the system is volatile and weak
Gold tried to reclimb and get close to the All time high, but in doing so it gets up against strong resistance zones where impatient sellers are eager to off-load their postions again.
Trump has announced Kevin Warsh as his fed chairman selection, this comes to no surprise really as the usd was only up 1% and gold didn’t react much initially. However, it might have been a small contributor to fridays move aside the above.
Has this changed now anything about the longterm structure that gold has established over the past few months and what can we do to eventually benefit from this market moves? Hint: I think, beyond technicals speaking - fundamentally gold remains sounds.
Golds Fundamental Case
The landscape for gold has undergone a structural transformation as we move into 2026. Following a record-breaking 2025 where prices surged nearly 64%, the metal has transitioned from a reactive “safe-haven” to a cornerstone strategic asset.
While traditional drivers like real yields still matter, they are increasingly being overshadowed by a “new regime” of institutional demand and geopolitical fragmentation. Spot prices were testing prices up to 5,500 USD USD/oz at the recent highs the fundamental case for gold is no longer built on temporary fear, but on a long-term reallocation of global capital.
De-dollerization Narrative
A historic rebalancing is occurring within global reserves as central banks aggressively pivot away from traditional sovereign debt and toward hard assets. By early 2026, the value of foreign central banks’ gold reserves has overtaken their U.S. Treasury holdings for the first time since 1996. This shift marks a structural “re-pricing of trust” in the stability of the dollar-led financial order.
Diagram 1: Central Banks Hold More Gold Than Treasuries

The world is witnessing a structural “dump” of U.S. Treasuries as the premier global reserve asset. For decades, central banks recycled trade surpluses back into U.S. debt, but that cycle has broken. In early 2026, major sovereign holders are aggressively reducing their exposure, fearful of both the $36 trillion U.S. debt mountain and the “weaponization” of the dollar. As they liquidate bonds, they aren’t rotating into other currencies; they are moving into gold, which hit a record 5,500 USD/oz this quarter as the only asset with zero counterparty risk. I am not going to delve here into the US debt and other economic factors - particular, because I found most of the debates around it misleading, I will explain this in a different article.
Central Banks
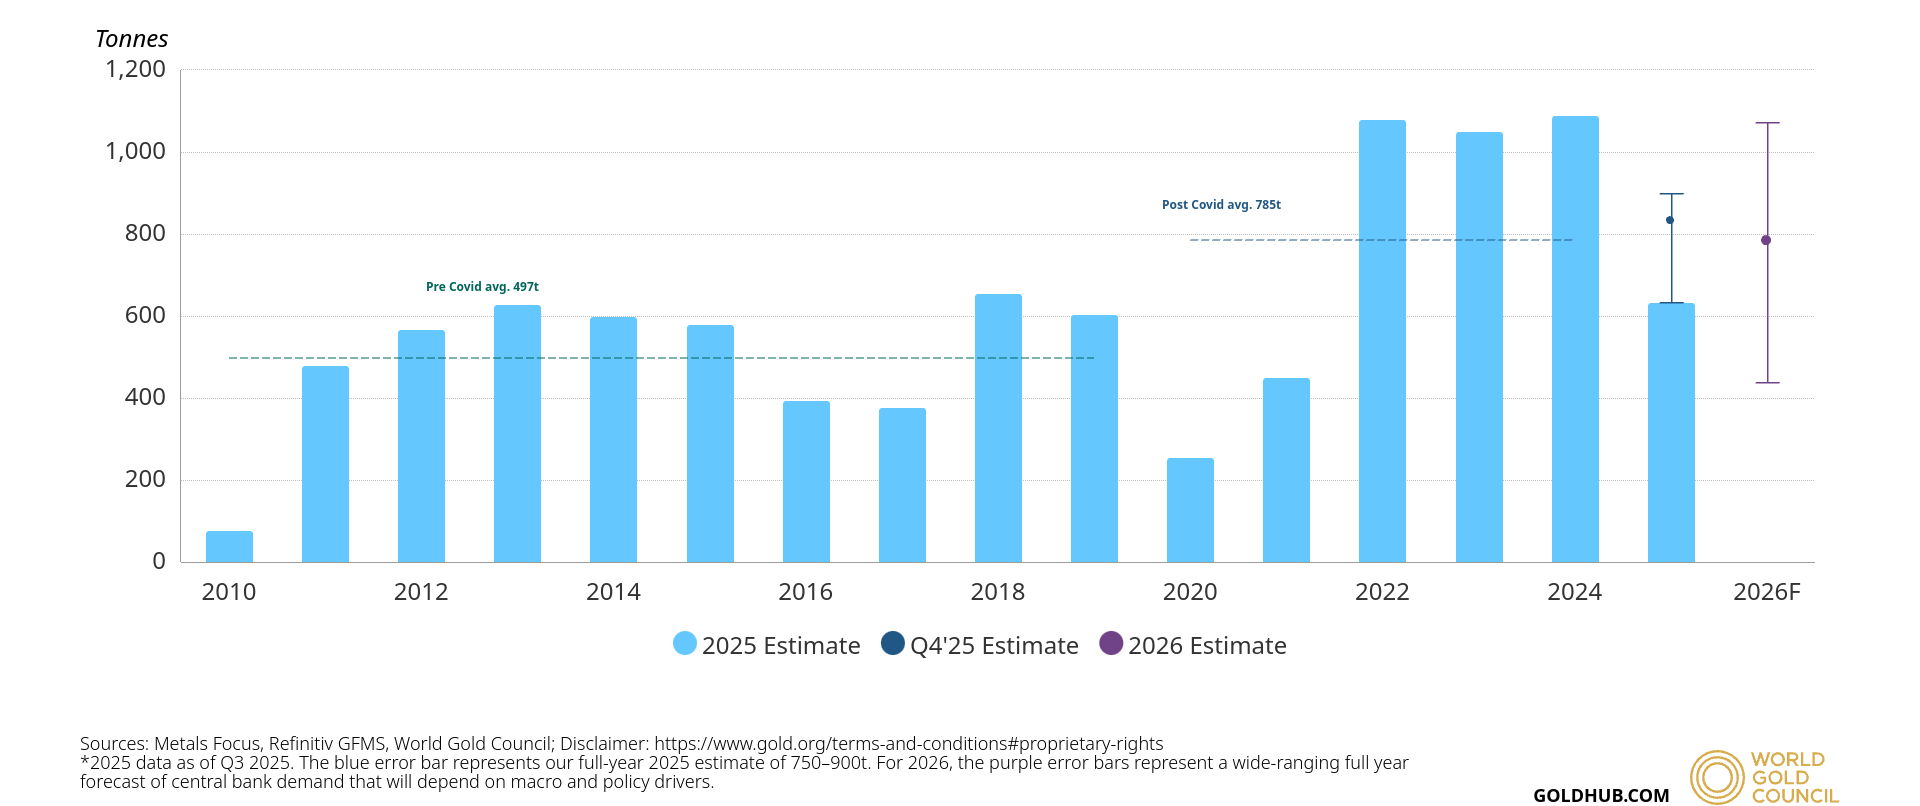
Central banks keep buying and buying, with Record Accumulation. After adding more than 1,000 tonnes annually from 2022 through 2024, central banks remained historically active in 2025, purchasing approximately 863 tonnes despite record-high prices. In 2026 the outlook is for approximately 800 additional tonnage to be bought by Central Banks.
Diagram 4: Central Banks Keep Buying and Outlook for this Year
Geopolitical “Weaponization”: The freezing of sovereign reserves has proven that offshore assets are vulnerable to political decisions. Gold held within a nation’s own borders offers an insurance policy that cannot be sanctioned or blocked.
Fiscal Sustainability Concerns: With U.S. public debt climbing toward $37 trillion and unpredictable trade policies creating market volatility, reserve managers are prioritizing the durability of gold over the yield of “politicized” paper assets.
Breaking the “Real Yield” Link: Traditionally, higher interest rates hurt gold. However, persistent central bank buying has broken this historical link, allowing gold prices to surge past 5,500 USD/oz in early 2026 even as real yields remain elevated.
Lastly, Gold is really the only market where you can store trillions in wealth after selling US treasuries to park your money there. Countries don’t have many options where they choose to park their
Jewelry Demand
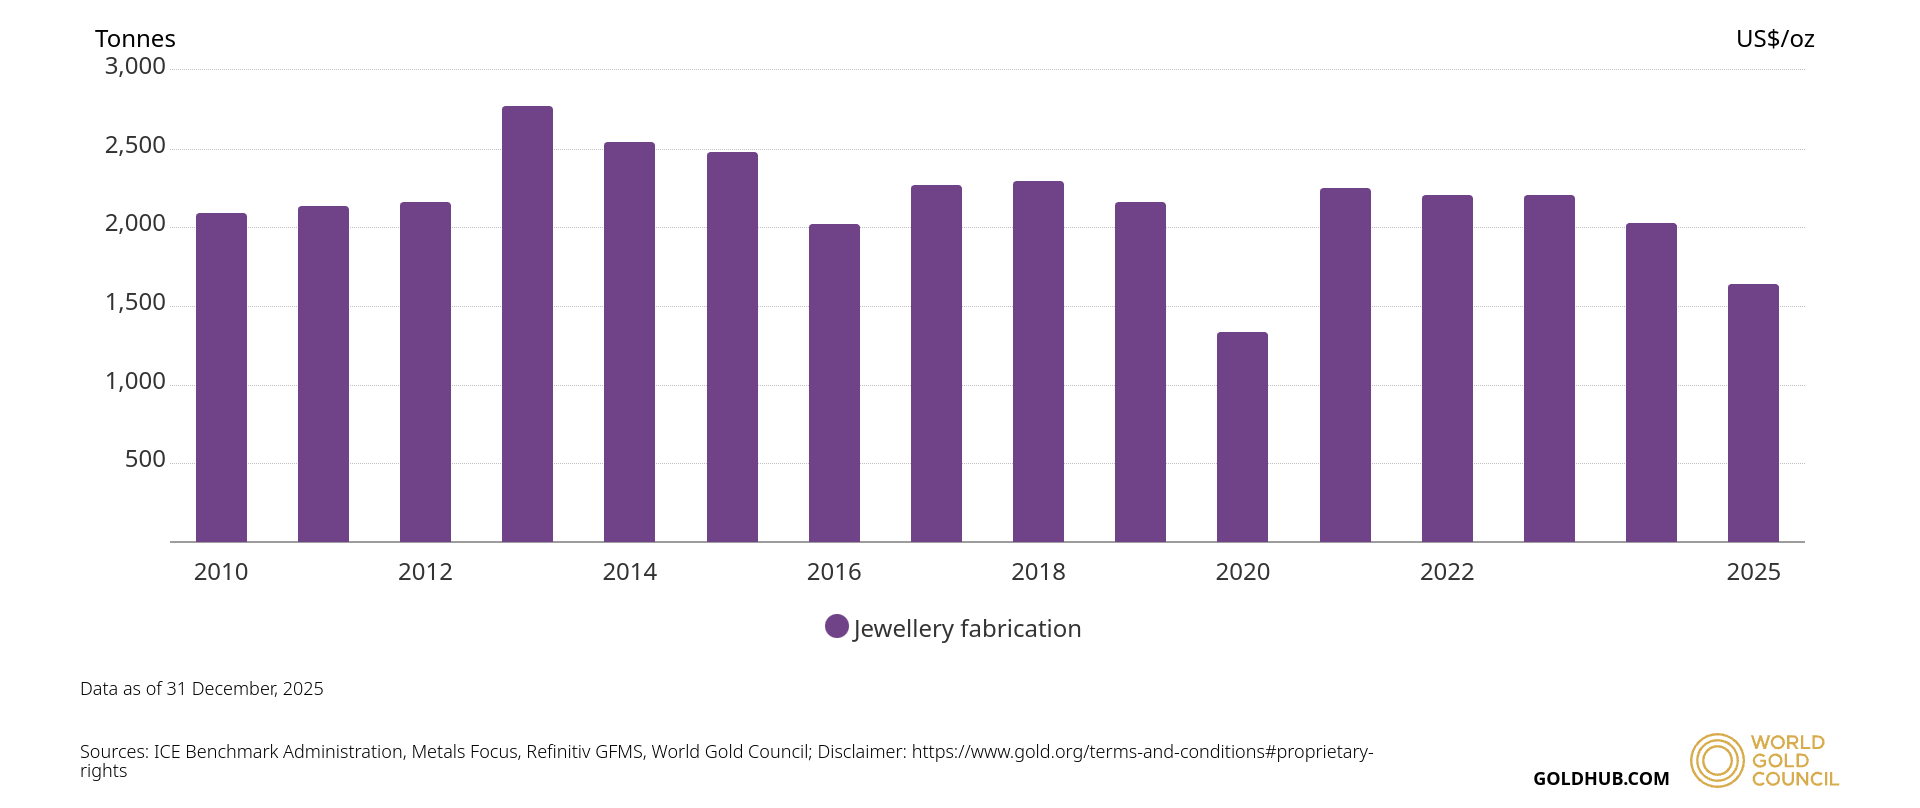
As gold prices reached unprecedented heights throughout 2025 and early 2026, the jewelry sector has experienced a sharp structural cooling. This is a classic example of price elasticity. In 2025, global jewelry demand volumes fell 18% to approximately 1,542 tonnes - which is still about 30% of yearly demand so a important part.
Diagram 3: Jewelry Demand of in the Past Few Years
Shrinking Volumes vs. Record Values
The relationship between price and demand in the jewelry market is currently defined by two opposing trends:
Tonnage Contraction: Consumers are buying fewer pieces and opting for lower gold weights, such as lightweight jewelry or designs that incorporate cheaper materials like synthetic gemstones.
Value Expansion: Paradoxically, while the physical amount of gold being used is dropping, the total dollar value spent on jewelry continues to expand. This indicates that higher-income consumers are still buying premium, high-carat pieces despite the “affordability gap” facing the broader market.
Retailers in price-sensitive regions like India and China have been forced to adapt to survive the “Gold Shock”. In India, consumers have shifted toward smaller ticket sizes and fixed-budget purchases to compensate for global spot prices testing 5,500 USD/oz. I could also dive into the technology demand, however that one is rather insignificant and by most accounts it does not fluctuate significantly enough to imapct gold prices.
Gold Investments/ETFs
While the massive rally toward $5,500/oz in early 2026 has been anchored by "smart money" institutions and central banks, the most recent parabolic move has been heavily fueled by a resurgence of retail or "dumb money" participation. For years, retail investors were net sellers, but the sheer momentum of new all-time highs in 2025 has triggered a powerful "fear of missing out" (FOMO) cycle among non-professional traders.
Diagram 5: Gold ETFs are now the Demand Driver
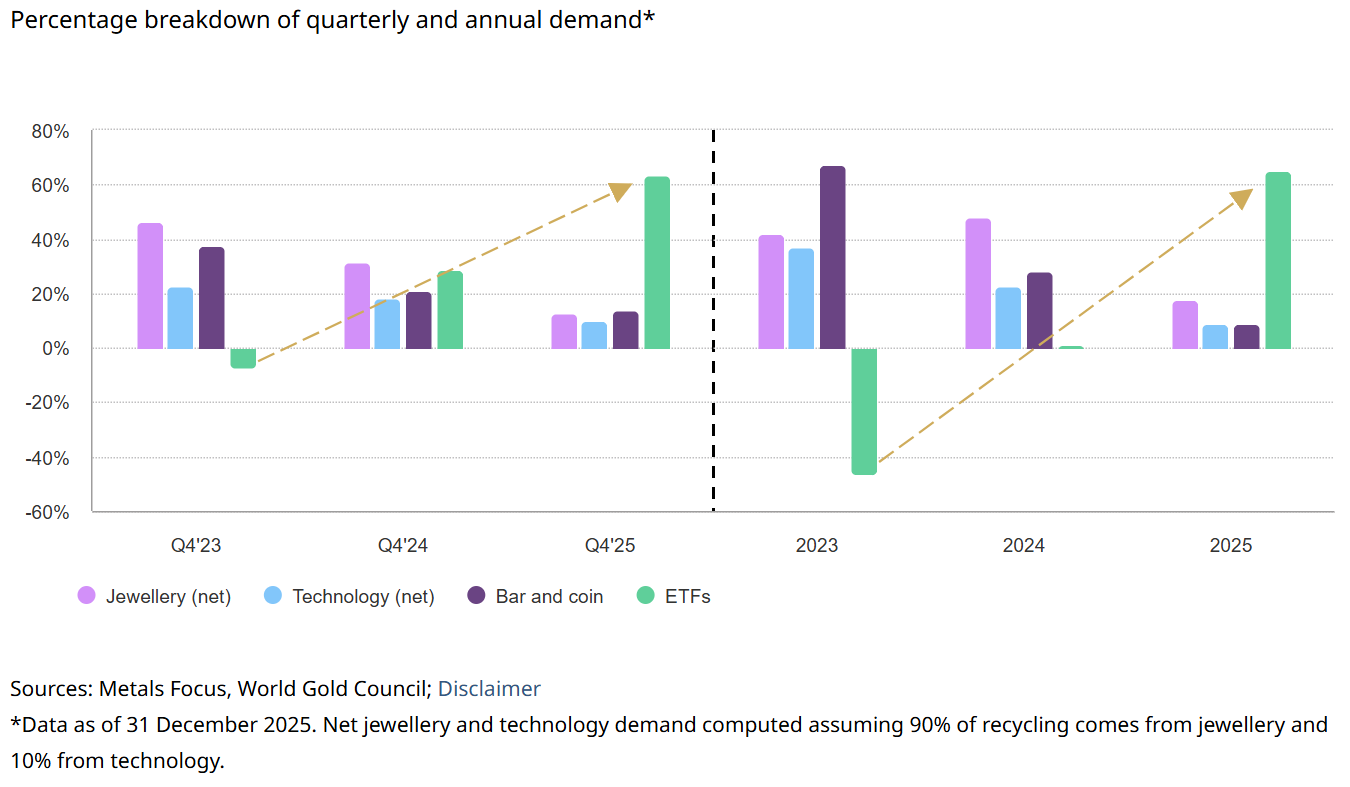
The above explaines a great deal of the recent moves in gold, and it can be said that it is driven by dumb money. However, we must also acknowlege that there are structural drivers for this and they remain long-term so any weakness will always find different groups will to increase their sizings.
Secondly, we have to acknowlege the Allocation Gap. Since as of December 31, 2025, gold-backed ETF assets accounted for only 2.8% of total global financial assets. This is significantly lower than the nearly 9% allocation seen during the 2011–2012 Global Financial Crisis and remains below the peak levels reached during the 2020 pandemic.
Diagram 6: Gloabl-Backed ETF assets as a percentage of global ETF assets
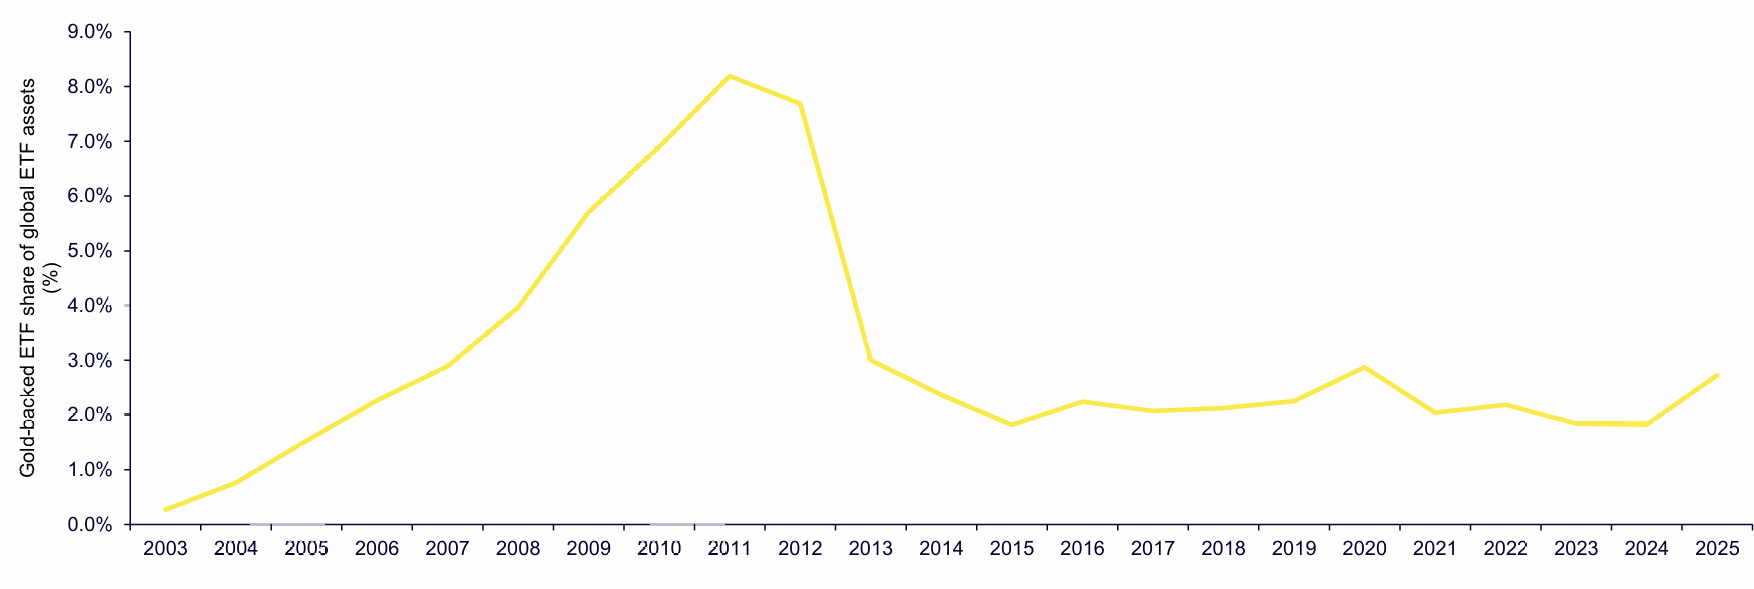
One can interpret this low allocation as a major bullish signal. If institutional and retail investors were to return to historical "crisis-level" weightings of 4% to 5%, it would represent hundreds of billions in new demand. This suggested "room to grow" long-term beyond just simply the current recent all-time-highs.
Just to provide a perspective in terms of how much current global etf gold holdings are in terms of tons, it is around 4000 tons with global demand hitting 800 tons from Q4 2024 to Q2025. This is about the same amount of gold holdings than it was back in 2020 as we can see below in the chart.
Diagram 7: Gold-backed ETFs Investment Flows Lack behind Previous Cycles
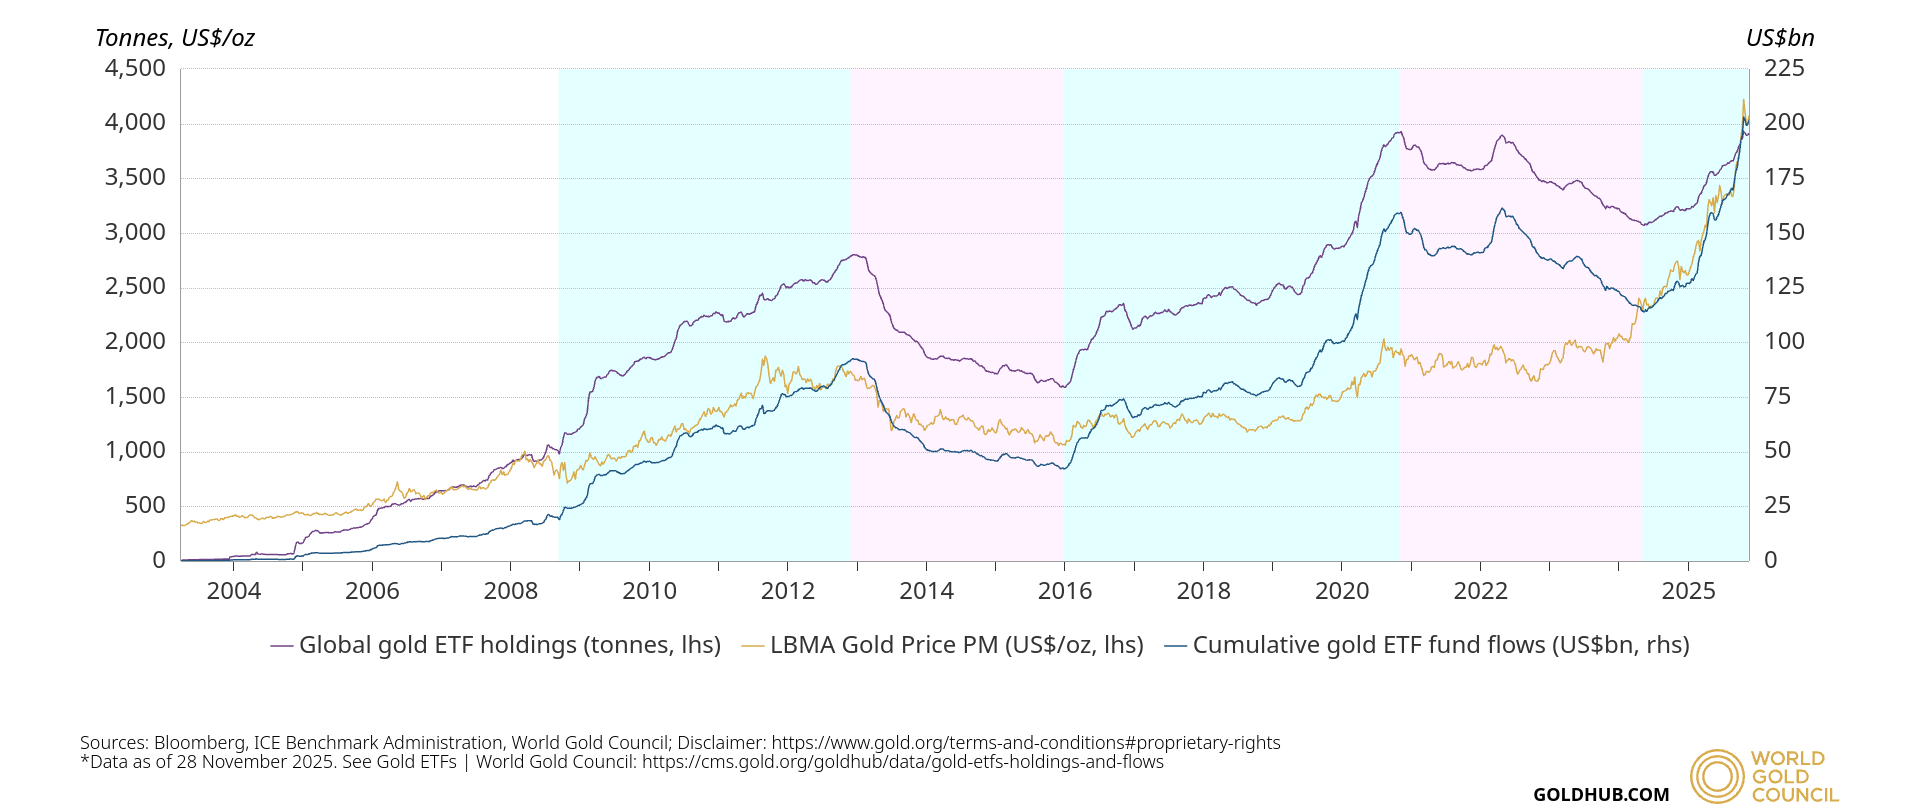
I personally prefer to use tonnes as a metric rather than how much the assets under management are, this can always just increase due to inflation itself. So if we take into consideration the current inventories and how much bigger the ETFs market has become, there is a massive potential for this to increase long-term.
That increase will be cyclical and have its flows and inflows, I think there is still a long-way to go and definitely makes gold having a floor around 4000-4500 USD all the more likely. We might get into a market were gold equities in terms of miners as well as etfs occupy a bigger slice of the global equity market.
Interest Rates
As we move through 2026, the traditional relationship between gold and the U.S. Federal Reserve has entered a critical phase. While the market is currently pricing in approximately 75 basis points (bps) of further rate cuts for the year, the path ahead is far from certain, creating a volatile environment for the metal's valuation
Diagram 8: CME Fedwatch Tool aggregated probabilities for Rate Cuts
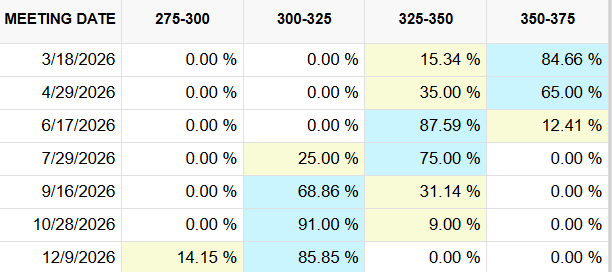
The projected path of rate cuts is now in jeopardy due to several key factors related to Warsh’s policy stance and institutional constraints:
Hawkish Track Record: Warsh is historically known as an “inflation hawk” with a near-zero tolerance for rising prices, having frequently warned about inflation risks even during the 2008 financial crisis.
Balance Sheet Priority: A defining feature of Warsh’s framework is his desire for “regime change” at the Fed, specifically a rapid reduction of its 6.6 USD trillion bond holdings. Shrinking the balance sheet naturally tightens financial conditions and could exert upward pressure on long-term bond yields, potentially making direct rate cuts less necessary or even counterproductive to his goals.
Overall to provide a concluding of the factors above I can note that ETF holding still can massively increase potential doubling(holdings) which can put a big floor for gold prices. All of the factors are pretty much longterm bullish and remain so, except jewlery tonnage will always decrease to a certain extend as the gold price increase(not necessarily total value). Interest rate policy remains uncertain, but it is more likely at least for now that we continue cutting rates into a strong gold and stock market, this can of course alway change.
What to watch out for
I’ll keep this one brief as the main analysis is above, but here is a list for what to look out for:
Sentiment: Watch for signs of “speculative mania” as gold’s technical readings hit 45-year highs in early 2026. While institutional buying is durable, a sudden influx of “novice investors” and mainstream media FOMO could signal a local peak followed by 20–30% corrections.
Geopolitical Concerns: Instability remains a primary driver, with 2026 tensions expanding to include tariff conflicts and unconventional risks in regions like Greenland as seen recently.
Central Banks & De-dollarization: Monitor the pace of official buying, which is projected to stay elevated at roughly 800 tonnes for 2026. The “threat of foreign asset freezing” is driving reserve managers to rotate hundreds of billions from U.S. assets into gold.
ETFs & The Rising Tide: Holdings remain low relative to other assets, providing significant capacity for new inflows. If even 0.5% of foreign-held U.S. assets diversify into gold, it would provide enough “firepower” to push prices above recent aths of 5.600 USD/oz.
Real Interest Rates & Fed Policy: Markets anticipate approximately 75 bps in further rate cuts for 2026. Lower real yields typically boost gold’s appeal, but a shift toward “less easing” or a long Fed pause could cool the current rally.
My Strategy for 2026
Personally, I have liquidated a majority of my holding on Friday as well as Thursday depending on the miners and that has partly to do with the sentiment.
Here are three key way that my strategy is centered around:
Short-term: With the last big drawdown that happen, I think we will churn around the 5000 USD area for some days until we march again down to a key area which is 4500 USD. Thats when miners become particularly interesting again. In any way, its going to be volatile.
Medium-term: In the most possible worst case and that area breaks, 4000 USD becomes a big liklihood as its been a key area for months and one of high volatility as well. I personally think there might be a decent chance of happening, but I rather start sizing bigger into gold at 4500 and the lower it goes, the bigger does my sizing become. DCA all the way - but, we have to churn and it won’t be easy.
Long-term: I am personally very bullish longterm on gold as I can see prices beyond 6000 USD gold within the next few years, due to all of the political uncertainty and ETF flows continuously increasing as gold becomes a more vital speculative and safe-haven asset again.
My particular view is that gold and especially some miners are really interesting in this currrent environment. I will try to step-up and deliver some gold miners in the coming weeks(none of which are a surprise), however as they get to experience a decline due to sentiment. Their valuation will become ever more appealing.
I also want to state that I use these rounded numbers as I like to keep it simple, if needed I can always change and adapt. Flexibility is important in these volatile markets. Lastly one might wonder why the ETFs part is the biggest. Well, when thats a big part of the new inflows and driving the market - they are more important than central banks as their buying for gold is unlikely to lead to a big frenzy among central bankers, but rather a slow constant buying over time.
Thats it for this time, and thank you for reading my article!
Cheers,
Lukas form Pixel Research
Disclaimer
This is not financial advice as Pixel Research content is not meant to be a substitute for financial advice. Since we don’t offer financial advice, the material provided shouldn’t be interpreted as tailored investment advice. It is crucial to carry out in-depth research and, if required, speak with a licensed financial expert before making any financial decisions.
I was feeling quite productive this weekend. Really thank you for reading this! It took quite some time to assamble the information. I will be coming out with some more articles next week as well as some interesting companies.
Excellent article!